
|
Chris D. Impey, Matthew C. Wenger, and Carmen L. Austin
University of Arizona, Tucson, United States
Astronomy: State of the Art is a massive, open, online class (MOOC) offered through Udemy by an instructional team at the University of Arizona. With nearly 24,000 enrolled as of early 2015, it is the largest astronomy MOOC available. The astronomical numbers enrolled do not translate into a similar level of engagement. The content consists of 14 hours of video lecture, nearly 1,000 Powerpoint slides, 250 pages of background readings, and 20 podcast interviews with leading researchers. Perhaps in part because of the large amount of course content, the overall completion rate is low, about 3%. However, this number was four times higher for an early cohort of learners who were selected to have a prior interest in astronomy and who took the class in synchronous mode, with new content being added every week. Completion correlates with engagement as measured by posts to the online discussion board. For a subset of learners, social media like Facebook and Twitter provide an additional, important mode of engagement. For the asynchronous learners who have continuously enrolled for the past 15 months, those who complete the course do so quickly, with few persisting longer than two months. The availability of a free completion certificate had no impact on completion rates when it was added midway through the period of data analyzed in this paper. This experiment informs a new offering of an enhanced version of this MOOC via Coursera, along with a co-convened “flipped” introductory astronomy class at the University of Arizona, where the video lectures will be online and class time will be used exclusively for small group labs and hands-on activities. Despite their typically low completion rates, MOOCs have the potential to add significantly to public engagement with science, and they attract a worldwide audience.
Keywords: Education; distance education; online learning; online education; science; science education; astronomy; astronomy education; MOOC
Higher education in the United States is in a state of flux and stress. Two and four year higher education institutions are still seen as a gateway to a better future and financial security, but the cost of a college education has increased by a factor of two (inflation-adjusted) over the past 30 years, and outstanding student loans of nearly a trillion dollars exceed credit card and automobile loan debt (Frye 2012). STEM (Science, Technology, Engineering, and Mathematics) education faces its own particular set of challenges. The science literacy of the average citizen is modest, leaving them poorly prepared to understand or judge technical societal issues like energy production, climate change, and genetic engineering (NSB 2012). Meanwhile, there is growing demand for graduates with technical skills and majors but the supply of trained graduates is inadequate. Completion rates for STEM majors are 40%, much lower than in non-technical subjects. The administration of President Obama has set a challenging goal of training 100,000 new STEM teachers and producing a million more STEM graduates (NSTC 2013).
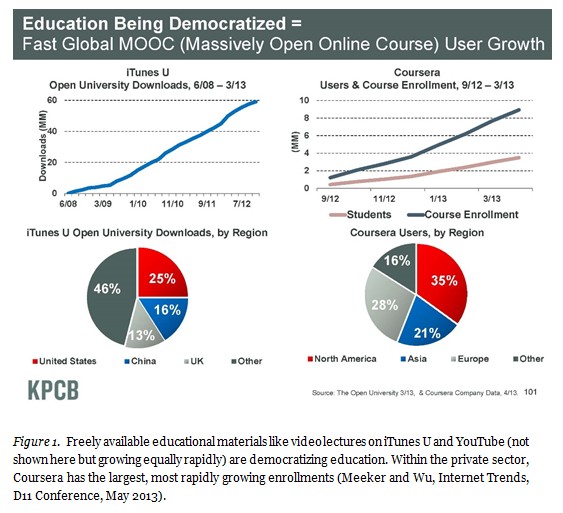
The rapidly increasing capability of the Internet and the availability of online content are rapidly eroding the “sense of place” in a college education. Online learning is not new but it has started to become a major component of the educational landscape. The number of students taking one or more online class grew from 2 million to 7 million from 2002 to 2011 and over that period the percentage of total college enrollment online grew from 10% to 32% (Figure 1, Meeker and Wu 2013). Reticence over the quality of online instruction is steadily diminishing; in a 2012 survey, 77% of the academic leaders at 2,800 U.S. colleges and universities considered purely online education to be the same as or superior to face-to-face education (Babson 2013). Set against this rapid growth is the fact that research-based and learner-centered teaching methods have not been adopted widely in science classrooms (NRC 2012). The challenge of implementing effective pedagogy without face-to-face contact or personalized interaction is an unsolved problem.
The instructional approach attracting the most media attention is MOOCs, or massive open online classes. The traditional MOOC is free, open to everyone, and does not result in university credit, so it is more appropriately considered outreach than formal education. Many universities are putting video lectures and entire courses online, and the number of iTunes U downloads has grown in four years to 60 million (Figure 1). Coursera is the largest company delivering online courses, and their course enrollment has grown at a meteoric rate, from 1 million in September, 2012 to 9 million in April, 2013. By lowering the bar for access to instructional materials and expert teachers, private companies like Coursera, edX, and Udacity are helping to democratize higher education. Companies like Udemy are making substantial contributions to professional development. For example, 75% of iTunes U downloads and 70% of Coursera users are located outside the United States (Masters 2011; Koller and Ng 2012). Coursera pioneered the delivery of online courses for transferable college credit. This opens up a new and powerful marketplace in higher education, where students can combine elements of a degree using local, face-to-face classes, and the best of the online offerings. MOOCs are often aimed at adult “recreational” or lifelong learners but a majority of the undergraduate population is now composed of students older than twenty-two, and these are often people with families and jobs. They will increasingly demand flexible delivery of the courses they are taking.
Along with spectacular growth and obvious promise, MOOCs have been subject to skepticism and pushback. Administrators are fearful of the threat to the current, unsustainable cost model for higher education but they also hope it may be a way to spread their “brand” to new markets, while educators are excited by the potential of the Internet as a learning medium but are suspicious that the quality of learning will be poorer when it is online. Research on MOOCs is in its early stages so there is a need for analysis informed by data gathered on classes that have firm pedagogical foundations. Some research questions are difficult to address due to privacy issues in the use of learner demographics an online behavior, and due to limited data analytics provided by some MOOC hosting companies. The factors that make for a successful MOOC are starting to emerge (McAndrew and Scanlon 2013; Reilly 2013; Ebben and Murphy 2014), and first results from the large-scale experiments of Coursera and edX are being published (Breslow et al. 2013; Perna et al. 2013). General metrics for performance and success of MOOCs across all subject are being developed for the first time (Klobas 2014). Completion rates are generally low, so understanding and increasing student engagement in the disembodied, online environment will be essential if MOOCs are to spread and flourish (Ramesh et al. 2014). A second, more profound issue is the distinction between engagement and learning. If the goal of a science class is to increase content knowledge and facilitate a high level conceptual understanding of science principles and process, which is much harder to facilitate and measure than mere engagement, particularly in an online environment (Reich 2015).
Astronomy: State of the Art is a MOOC specifically developed to study student participation in an online learning environment. The project aims to serve multiple audiences of learners. One is those self-motivated adults who take a free course out of interest in the subject and not to get a degree or for university credit; this is the traditional audience for a MOOC. Another is a set of college students who use the online environment for lectures and quizzes but whose classroom time is devoted to hands-on activities and group work; this is the “flipped classroom” model. A third we plan to serve in the future is composed of students remote from the university offering the MOOC, who are paying to take a completely online class for transferrable university credit; this is the part of the landscape with the potential to disrupt the traditional economic model of higher education. Our group is developing tools to work with all of these audiences, as far as possible using methods that are interactive, centered on learners, and grounded in research methods. Astronomy is an attractive vehicle for science literacy and outreach because it is a dynamic subject with new discoveries announced almost weekly. The web site for the class is http://www.udemy.com/astronomy-state-of-the-art/. Enrollment is free.
The first implementation of Astronomy: State of the Art was intended as an outreach vehicle for a broad public audience. All aspects of astronomy from planets to cosmology were included, but the emphasis was on exciting topics where the research progress has been rapid: large telescope construction, adaptive optics, Solar System exploration, exoplanets, black holes, dark energy and dark matter, and big bang cosmology. Udemy was selected as the provider of the free course in part because a course can be offered by a single instructor without an institutional commitment. The privately-held company is smaller than Coursera and edX but has also been growing very rapidly, reaching 5 million students and 22,000 courses in early 2015 (www.udemy.com). Most Udemy courses are on technical subjects and for professional development and the courses are asynchronous in the sense that a student can sign up for the course at any time and follow the material at their own pace. The company doesn’t offer the infrastructure for any testing beyond multiple choice questions. But the architecture and user tools for video content are robust and scalable and they were entirely adequate for this experimental course. The instructor for the course was a senior professor in the Department of Astronomy at the University of Arizona, who has taught many face-to-face astronomy courses at the introductory and advanced undergraduate levels (CI). He was assisted by a half-time staff educational technologist (MW), and a half-time undergraduate teaching assistant (CA), who were responsible for creating and editing video lectures and weekly assignments, as well as communicating with the students on the course web site and using social media.
Our goals in this project included creating the first MOOC that presented astronomy in terms of the cutting edge topics that define the research frontier. A MOOC can have a broader goal than an introductory college class, since it accesses a demographic that is typically more mature, with more people who take the class out of general interest than because of a university requirement. Adult learners do not need or expect to master the formal apparatus of physics and mathematics needed to comprehend the universe. But they can be given a conceptually high level treatment that lets them share in the excitement of research on black holes and exoplanets and cosmology. Another goal was to investigate the behavior of two cohorts: the pre-registered group who had a prior interest in astronomy and the continuously enrolling (and much larger) group encountering the class in the Udemy marketplace. A third motivation was to investigate correlations between various modes of engagement, such as accessing course materials and usage of social media.
This course has gone through two modes: one “active” and a subsequent “passive” mode. The course was initially designed as a seven-week class to be offered beginning in March, 2013. In this synchronous early phase, a series of lecture videos was released each week, along with self-guided assignments and additional material for students to explore on their own. The additional content consisted of reading material and podcast interviews with scientists at the University of Arizona engaged in research related to the weekly topic. The core content is a series of video lectures that total about 14 hours. Video was primarily filmed as first person “talking head” of the instructor shot against a green screen so that backgrounds could be added later, interspersed with relevant animations, images, and video clips. The footage was edited and rendered in Final Cut Pro 10. There were between five and seven videos for each week’s topic; each video lasted an average of ten minutes with the shortest being around five minutes and the longest less than 20 minutes. All videos were subsequently posted on YouTube so they would be available for people not enrolled in the Udemy course (https://www.youtube.com/user/AstronomySOTA).
In addition to the videos, each of the seven major sections of content had a brief overview video, lasting 2 to 3 minutes. Additional material for each section included a downloadable pdf file of a Powerpoint slide presentation consisting of 80-130 slides, a reading 20-30 pages long taken from one of the instructor’s popular science books, and links to several 40-minutes podcast interviews with researchers and faculty at Steward Observatory and the Department of Astronomy. A quiz was created for the first section, and the rest of the assignments consisted of participation in the citizen science of the Zooniverse project (http://www.zooniverse.com). Participants could also communicate with the teaching team through question and answer and discussion threads on the course website, and through social media on Twitter (https://twitter.com/AstronomySOTA) and Facebook (https://www.facebook.com/AstronomySOTA). In addition, there have been live video discussions where students can have questions answered in real-time by the instructor. These sessions occurred weekly during the first seven weeks of the class, decreasing to once every few weeks subsequently.
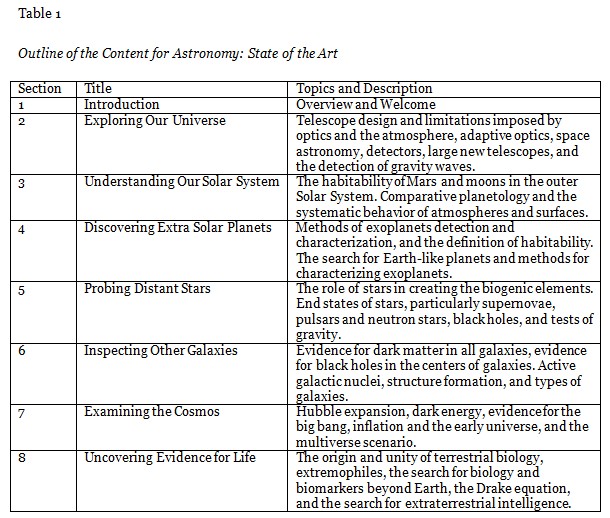
An astronomy MOOC does not have the same instructional goals or technological underpinnings as a conventional class where students are evaluated on both content and physical principles. As a result, the video lectures and ancillary material did not go into detail on some core topics in a college-level astronomy class: positional astronomy, radiation physics and the inverse square law, atomic structure, comparative planetology, the Hertzsprung-Russell diagram that describes stellar evolution, and the classification and structure of galaxies. Table 1 provides an outline of the course content.
Astronomy: State of the Art went “live” on March 26, 2013. To “prime the pump” for the new class, the course was announced on the Teach Astronomy web site, which was created by the instructor in 2011 to support General Education astronomy classes at the University of Arizona (http://www.teachastronomy.com). That site was at the time getting 300 unique visitors a day, the majority of which were not college students but were members of the general public with an interest in astronomy. The instructor also publicized the course in emails to over 600 astronomy instructors in the United States, and with flyers mailed to over 800 amateur astronomy clubs in the United States. These initiatives, plus use of social media to reach astronomy fans, probably reached as many as ten thousand people in the run up to the launching of the class, and by the time the class started over 700 had pre-registered on the Teach Astronomy web site.
As a result, 833 people were enrolled when the class started on March 25, 2013, and all of them can be presumed to have prior interest in astronomy since the class had not yet been advertised in the Udemy online “marketplace.” Enrollment stood at 1,383 when the class entered Udemy’s marketplace on April 2, 2013, and 1,991 were enrolled when the class ended its active mode (with new content being added weekly) on May 15, 2013. Given rates of enrollment before and after April 2, at least 70% and as many as 90% of the 1,991 enrolled on May 15 came via active solicitation. This early cohort is probably atypical when compared the more than 14,000 people who enrolled subsequently, since it preferentially includes people with a strong prior interest in astronomy. Comparison of the behavior of these two cohorts is the most important “internal experiment” reported in this paper.
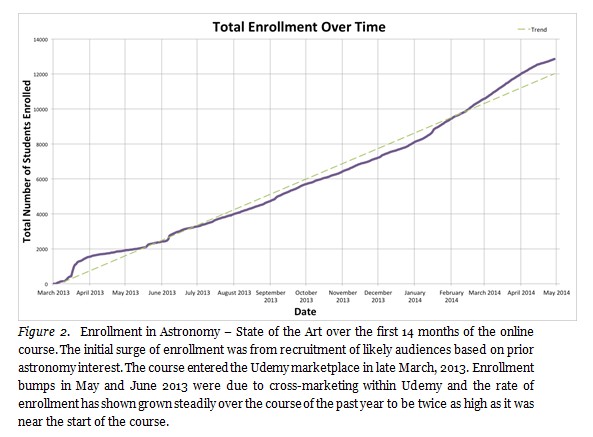
Soon after the launch of the course, it was approved to be part of the Faculty Project, a set of Udemy courses typical of a Liberal Arts college curriculum (http://www.facultyproject.org/). During the second, passive or asynchronous phase of the course, students enrolled steadily and explored the online materials at their own pace. Enrollment has grown steadily since the course started with more than 1,000 new students adding the course every month (Figure 2). The course is in the top 100 for enrollment among over 13,000 courses in the marketplace of Udemy. The average rating for the class among 300 people who submitted an evaluation online is 4.95 out of 5 stars. In terms of enrollment and student ratings, the course is in the top five of the nearly 200 Liberal Arts courses offered by Udemy. The ratings suggest the course is meeting its goal of providing a high quality lifelong learning experience in astronomy for a geographically dispersed audience.
The authors of this study have completed Human Subjects training at the University of Arizona and the project has institutional review board (IRB) approval to use course data for research purposes, following the proviso that the data does not have names or student identifiers attached. IRB training involves the investigators and authors of this paper studying material and passing a test on the ethical uses of human subjects data. The data in this study were provided by Udemy as a series of seven “snapshots,” with the most recent downloaded in June 2014. Random sampling of 600 student names as they enrolled suggest that about a third of them are from outside the United States (based on foreign alphabet characters in the names) and about a third are women (based on names with unambiguous associated gender). More detailed statistics come from Google Analytics, which can be used to track unique users, sessions, page views, and average duration of a session (Figure 3).
Enrollment for the course has maintained a steady climb since the initial rollout and surge in numbers at the beginning. The rate of enrollment is approximately 900 students per month. The Udemy and Google statistics show the unusual nature of the first cohort who enrolled for the first, “active” mode of the class, from March 26 to May 15, 2013. Over this interval, on average each week saw the course host about 700 users, 1,800 sessions, 8,000 page views, and sessions that lasted about 18 minutes. Over the following three months the average numbers dropped to 350 users, 600 sessions, 2,000 page views, and sessions that lasted about 8 minutes. Over the subsequent eight months, the average weekly number of users grew to about 1,000, the number of sessions to about 1,300, and the number of page views to about 4,000. Given steady enrollment growth over this past year, the implication is that the students who followed the first synchronous cohort are much less actively engaged in the material. This impression is accentuated by the data on average time per session, which has fallen over the duration of the course from 18 to about 5 minutes in the Spring of 2014.
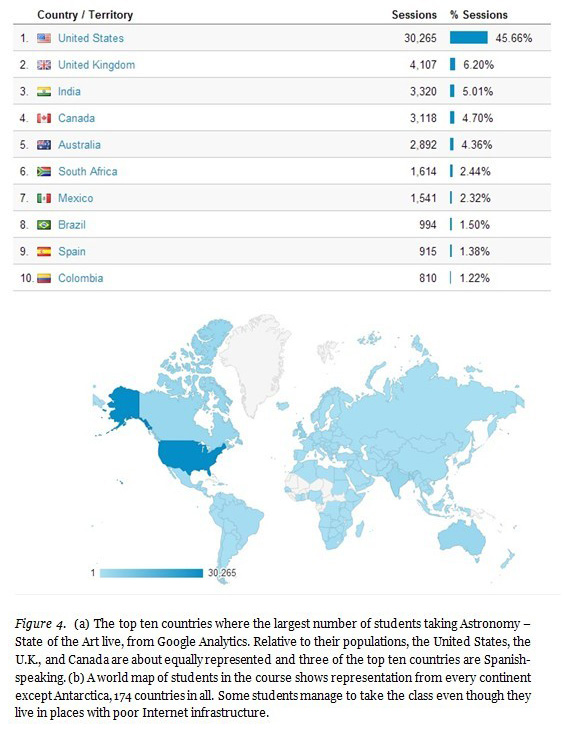
MOOC audiences are often geographically dispersed, and this course is no exception. From Google Analytics, about 45% of the users (and sessions) since March, 2013 have originated in the United States. The rest of the top ten in number of sessions are the United Kingdom (6.2%), India (5.0%), Canada (4.7%), Australia (4.3%), South Africa (2.4%), Mexico (2.3%), Brazil (1.5%), Spain (1.4%), and Columbia (1.2%). Intriguingly, Mexican users spend twice as much time per session as users in any other country. This effect has not been noted anywhere else in the limited MOOC literature and is possibly related to the generally poor bandwidth of access to the Internet in Mexico. English-speaking countries dominate the top ten (Figure 4a); among the next twenty countries in the list only one (Ireland) is English-speaking. A map of users shows representation from every continent (Figure 4b). A remarkable 174 countries are represented, including single users in Laos, Madagascar, Turkmenistan, Tonga, and Vanatu. MOOCs truly represent a global phenomenon.
Although Udemy offers limited demographic data to instructors, a snapshot of the enrollment habits of the class was obtained by viewing the home pages of 500 participants. This showed that, at the time they first enrolled for Astronomy: State of the Art, 45% of the participants had only enrolled for this astronomy class, so it was their first exposure to a MOOC. But there was a long tail of people who were enrolled in many classes on Udemy. About 10% were signed up for 50 or more classes and a handful had signed up for several hundred classes. Since no financial commitment is required for the many free classes on Udemy, this illustrates the phenomenon where some people engage in “stamp collecting,” or signing up for many classes that they have no intention or time to complete. Again, the more committed nature of the early cohort stands out. Among the 400 students who had enrolled before the class formally started, 85% were only signed up for Astronomy: State of the Art and fewer than 10% had signed up for more than one other Udemy class.
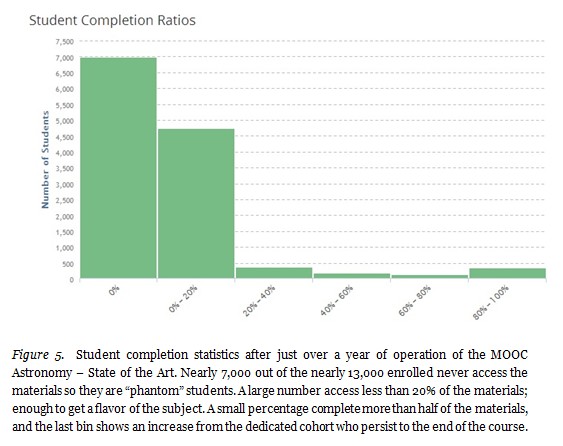
The classic MOOC sets the bar low for learners since there is no cost and no grades, with the corollary that the level of engagement can also be very low. Astronomy: State of the Art has a large amount of content, amounting to about 14 hours of video, 800 lecture slides, 500 pages of readings, and 15 hours of podcasts. The most sobering statistics come from completion metrics (Figure 5). Udemy measures completion as the fraction of the content viewed or accessed. For video lectures this is the percentage of the total video played, bearing in mind that the video being streamed does not prove that it was actually watched. For lecture slides and readings, an algorithm converts the content into equivalent minutes of engagement. In this course, podcasts were accessed by links outside of Udemy so they don’t count as content in terms of completion. Just over half of the people who enroll never access the materials, consistent with statistics for many MOOCs. Of those accessing the class materials, 3.2% complete all of them, 4.3% complete half of them, and 7.3% complete a quarter of them. The rate of completion has remained fairly consistent over time with a completion rate of 25 students per month, or just a few percent of the number of students enrolling in the course each month. The astronomical number enrolled is largely misleading; participation statistics bring it down to Earth.
The emerging research literature on MOOCs is beginning to identify the factors that affect completion and retention (Adamopoulos 2013). Factors causing high attrition include lack of time, lack of motivation, feelings of isolation and lack of interactivity online, poor preparation and skills, and perceived hidden costs to MOOCs (Khalil and Ebner 2014). Completion rates should only be evaluated in the light of students’ self-reported intentions, which also affects strategies for personalizing a MOOC (Reich 2014). One study of dropouts from a MOOC found that the time commitment required and a lack of challenging activities contributed to the poor completion rate (Gutl et al. 2014), but in common with other studies also determined that most students never had any intention of completing the MOOC when they enrolled.
Course completion rates were noticeably different between the initial cohort who signed up during the “active” or synchronous portion of the course, and those who signed up during the “passive” phase. Of the initial cohort of 1,991 students who joined the class during the “active” mode, 7.5% completed the course. The cohort of students who joined the course during the “passive mode” has lower completion rate of 3.3%. In addition, the time to completion is noticeably different between cohorts (Figure 6). Students in the first “active” mode cohort took around seven weeks (median=51 days, mode=45-49 days) to complete the course content. This should come as no surprise, since the course content was released on a weekly basis for seven weeks. Students in this first cohort who joined slightly after the start date took a little less time to finish the course since the content was already posted when they arrived. By contrast, students in the second “passive” mode cohort have generally completed the course quickly (median=33 days, with the largest group of students in this second cohort completing the course content in less than five days (mode=0-4 days). What we find is that completion times for the first cohort are clustered more closely together, compared with students in the second cohort who were able to pace themselves, and completion times are more varied. Even though there were 10 days in between the day the final “active” content was posted, and the cutoff date for the first cohort, no one in the first cohort finished in less than 25 days, whereas with the self-paced students in the second cohort, nearly 50% of the students completed the course in that amount of time.
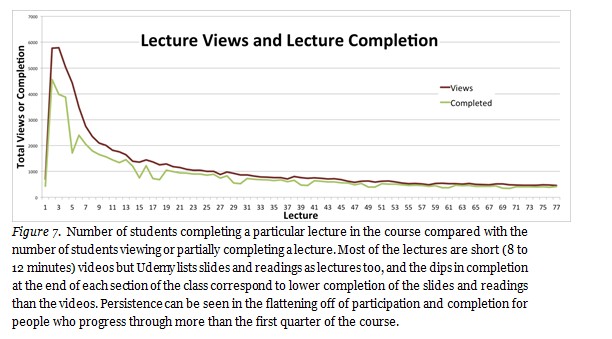
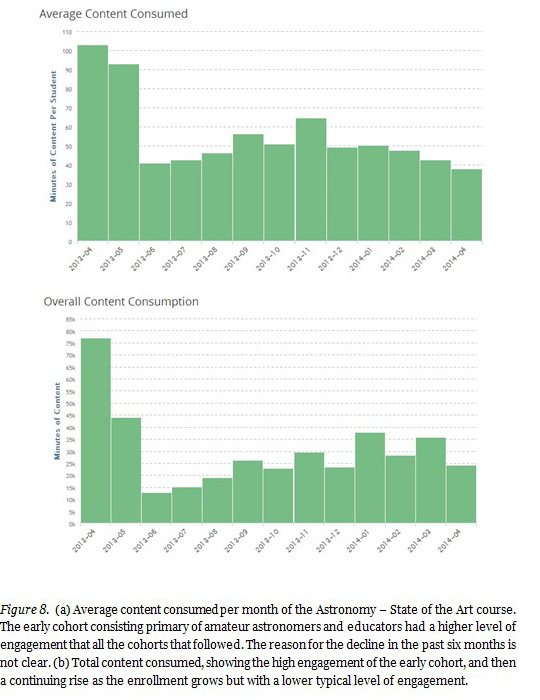
Most people access the content sequentially, so a much higher fraction views the first and early modules of the class than views the later modules (Figure 7). The last two graphs can be used to loosely categorize students of this MOOC into three groups: “phantoms,” who enroll but never access the materials, “dabblers,” who view a handful of video or completion a small fraction of the course, and “persisters,” who complete the course or view most of the course materials. In fact, research on one biology MOOC with Coursera showed that first week performance and social interaction is a strong predictor of final performance (Jiang et al. 2014). Even though the participation and completion rates are low, the high aggregate engagement can make a MOOC an effective vehicle for outreach (Figure 8). Early adopters were watching 90 minutes or more of content, and even the less engaged later cohort is on average watching 40-50 minutes of content. The aggregate after just over a year is nearly 400,000 minutes or 6,700 hours, equal to 10,000 people watching a typical public lecture on astronomy, involving reaching audiences who might not otherwise be able to enjoy cutting edge science. MOOCs will undoubtedly play a role in combatting low levels of science literacy in the United States (Impey et al. 2011, 2012).
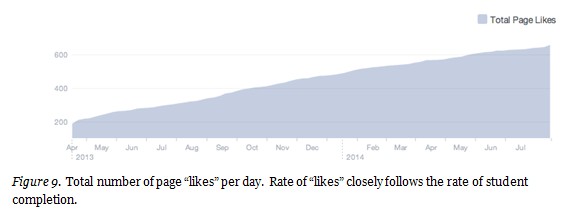
While there is a natural explanation for the high degree of participation of the early students who enrolled in the class, there is no explanation for the slow decline in participation over the past six months, manifesting in lower completion rates and rates of watching lectures, and lower rates of posting question and reviewing the course on the Udemy site. In fact, starting in June, 2013, all those enrolled were able to get completion certificates if they viewed all of the materials. This fact was well-publicized by Udemy and by several posts from the instructor. Given that the great majority of students are far from completion, a certificate presumably did not act as sufficient incentive. However, the null result of a certificate as an incentive to completion is significant given that Coursera has made paid and validated certificates a core component of their business model. Another component of the course involved social media. Astronomy: State of the Art has a Twitter feed, a Facebook page, and a blog, and all three have been used to update students on recent developments in astronomy and keep them involved in the class. Facebook is the most useful tool; the rate of visitors to the course page mirrors the rate of visitors to Udemy (Figure 9). Due to the privacy restrictions on Facebook data, we could not correlate the use of social media with access to the class materials on the Udemy site.
Astronomy: State of the Art succeeded in its goal of drawing a large number of people to the subject of astronomy, and giving them an overview of a vibrant subject of scientific research. Over 23,000 are currently enrolled, and the number increases by about a thousand each month. However, more than half of those enrolled never access the online materials and the completion rate has been low. This experiment with Udemy yielded valuable experience in video editing, conducting live sessions, boosting participation and interest using social media (particularly Facebook and Twitter), tracking metrics of engagement, and diagnosing and setting appropriate learner expectations. We have no prescription to address the issue of low completion rates (Reilly 2012), and a proportion of phantoms and dabblers are inevitable with an online science class, where people act initially out of curiosity and with no intention of a major commitment. Completion rate in this MOOC is correlated with a high prior interest in astronomy, which is unsurprising. But it is also correlated with engagement through both synchronous (live sessions) and asynchronous (Q&A threads, social media) channels, which suggests that the video lectures and online quizzes that form the pedagogy of most MOOCs are not sufficient. Learners will do better when they have multi-modal engagement with the material and the instructor.
We plan a second experiment in 2015 with Coursera, with which the University of Arizona has recently become a partner. Coursera has superior infrastructure than Udemy for online evaluation and testing, and they have facilitated a growing base of instructional research (Koller et al. 2013). The Udemy MOOC will continue to be open to anyone who is interested. For Coursera, several additional audiences with professional or personal motivations for deeper engagement will be recruited. High school astronomy teachers will be recruited from a national pool of about 1,500 to enhance their content knowledge and for professional development credit (Berendsen 2005). Also, there are about 800 astronomy instructors at community colleges and two-year colleges, who teach a quarter of a million students per year (Fraknoi 2001). Most do not have a degree in astronomy; they will value the content rigor and research currency of this MOOC. The most dedicated members of these cohorts will be recruited as citizen scientists for projects in the course, and as learning assistants in subsequent offerings of the MOOC. There is very little control over the motivations of students who participate in a MOOC as a free-choice learning experience, just as museums have little control over the motivations of their customers (Bell et al. 2009; Donovan and Woods 2001). But it is possible to control the degree to which participants’ expectations are met. One eventual goal of this project is to understand the motivations of MOOC participants, to shape their expectations for how the MOOC will serve their education needs.
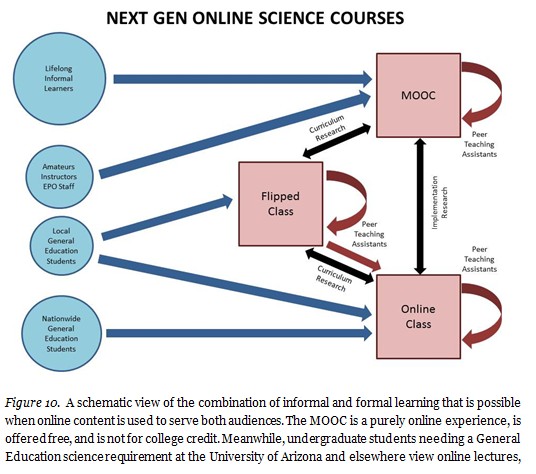
In the future, the classic MOOC, which primarily has an outreach function, will be co-convened with “The Physical Universe,” a Natural Sciences course taught at the University of Arizona that satisfies a General Education requirement for non-science majors. Using the same core material as Astronomy: State of the Art (with additional modules on the physics of radiation, atomic structure, energy, and gravity that are not necessary for the informal learners), the local course will employ a “flipped” model where the students access lectures and podcasts online but are in a face-to-face classroom two times a week for labs and hands-on activities, lecture tutorials, group discussions, and other research-validated tools for enhancing learning. A key goal in developing a “next generation online science class” is to migrate the most pedagogically effective methods of the face-to-face classroom to a completely online environment (Prather et al. 2011). A flipped or hybrid model gives students flexibility, uses the online medium for the aspects of instruction where interaction with an instructor isn’t required, and optimizes the scarce resource of time in a large classroom (Figure 10). The eventual goal is to recruit undergraduates from anywhere in the United States and award them transferrable credit for completing the class. The audience will be students who need a science class as a graduation requirement or who are piecing together a degree with a mixture of online classes and face-to-face classes from their local institution.
We acknowledge conversations and insights from colleagues and educational researchers at the University of Arizona, particularly Ed Prather and Sanlyn Buxner. Udemy staff provided us with excellent support and were responsive to most issues we raised regarding the platform. Chris Impey is grateful for support from the Howard Hughes Medical Institute.
Adamopoulos, P. 2013. What makes a great MOOC? An interdisciplinary analysis of student retention in online courses. Thirty Fourth International Conference on Information Systems, 1-21.
Babson 2013. Changing course: 10 years of tracking online education in the United States. Babson Survey Research Group, January 2013.
Bell, P., Lewenstein, B., Shouse, A.W., and Feder, M.A., eds. 2009. Learning science in informal environments: People, places, and pursuits. Washington, DC: National Academies Press.
Berendsen, M.L. 2005, Conceptual astronomy knowledge among amateur astronomers. Astronomy Education Review, 1(4), 1-18.
Breslow, L. et al. 2013. Studying Learning in the Worldwide Classroom: Research into edX’s First MOOC. Research and Practice in Assessment, 8, 13-35.
Donovan, & R. Woods, eds. 2001. Free-choice science education: How we learn science outside of school. New York, NY: Teachers College Press, 3-20.
Ebben, M., and Murphy, J.S. 2014. Unpacking MOOC scholarly discourse: A review of nascent MOOC scholarship. Learning, Media, and Technology, in press.
Fraknoi, A. 2001. Enrollments in astronomy courses. Astronomy Education Review, 1(1), 121-3.
Frye, R. 2012. A record one-in-five households now owe student loan debt. Pew Social and Demographics Trends Report. Pew Research Center.
Gutl, C., Rizzardini, R.H., Chang, V., and Morales, M. 2014. Attrition in MOOCs: Lessons learned from dropout students. Communications in Computer and Information Science, 446, 37-48.
Impey, C., Buxner, S., Antonellis, J., Johnson, E., & King, C. 2011. A 20-year survey of science literacy of college undergraduates. Journal of College Science Teaching, 40(4), 31-37.
Impey, C., Buxner, S., & Antonellis, J. 2012. Non-scientific beliefs among undergraduate students. Astronomy Education Review, 11(1), 010111.
Jiang, S, Williams, A.E., Schenke, K, Warschauer, M., and O’Dowd, D. 2014. Predicting MOOC performance with week 1 data. Proceedings of the 7th International Conference on Educational Data Mining, 273-275.
Khalil, H., and Ebner, M. 2014. MOOC completion rates and possible methods to improve retention – a literature review. World Conference on Educational Multimedia, Hypermedia, and Telecommunications, Association for the Advancement of Computing in Education, Chesapeake, VA, in press.
Klobas, J.E. 2014. Measuring the success of scalable open online courses. Performance Measurement and Metrics, 15(3), 145-162.
Koller, D., and Ng, A. 2012. The Online Revolution: Education at Scale, at www.coursera.com
Koller, D., Ng, A., Do, C., and Chen, Z. 2013. Retention and intention in massive open online classes: In depth. Educause Review, April/May issue, at www.educause.edu/ero/.
Masters, K. 2011. A brief guide to understanding MOOCs, The Internet Journal of Medical Education, Vol. 1, Number 2.
McAndrew, P., and Scanlon, E. 2013. Open learning at a distance: lessons for struggling MOOCs. Science, 342, 1450-1451.
Meeker, M. and Wu, L. 2013, Internet Trends, D11 Conference, May 2013.
NSB 2012. Science and Engineering Indicators 2012. National Science Board, Washington, DC.
NRC 2012. Discipline-based education research: Understanding and improving learning in undergraduate science and engineering. National Research Council, Washington, DC.
NSTC 2013. Federal science, technology, engineering, and mathematics education 5-year strategic plan. National Science and Technology Council, May 2013.
Perna, L. et al. 2013. Life cycle of a million MOOC users. Presented at the MOOC Research Initiative Conference, Arlington, Texas.
Prather, E.E., Rudolph, A.L., & Brissenden, G. 2011. Using research to bring interactive learning strategies into general education mega-courses. Peer Review, 13(3), 27-30.
Ramesh, A. et al. 2014. Uncovering hidden engagement patterns for predicting learner performance in MOOCs. Proceedings of the First ACM Conference on Learning, ACM, New York, NY, 157-158.
Reich, J. 2014. MOOC Completion and retention in the light of student intent. EDUCAUSE Review Online, December 8, 2014.
Reich, J. 2015. Rebooting MOOC research. Science, 347, 34-35.
Reilly, C. 2013. MOOCs deconstructed: variables that affect MOOC success rates. Presented at the World Conference on E-Learning, Las Vegas.


© Impey, Wenger, and Austin