


 |
 |
 |
 |
Curtis R Henrie, Robert Bodily, Kristine C Manwaring, and Charles R Graham
Brigham Young University, United States
In this exploratory study we used an intensive longitudinal approach to measure student engagement in a blended educational technology course, collecting both self-report and observational data. The self-report measure included a simple survey of Likert-scale and open-ended questions given repeatedly during the semester. Observational data were student activity data extracted from the learning management system. We explored how engagement varied over time, both at the course level and between students, to identify patterns and influences of student engagement in a blended course. We found that clarity of instruction and relevance of activities influenced student satisfaction more than the medium of instruction. Student engagement patterns observed in the log data revealed that exploring learning tools and previewing upcoming assignments and learning activities can be useful indicators of a successful learning experience. Future work will investigate these findings on a larger scale.
Keywords: Student engagement; blended learning; measurement
There is a growing emphasis on student engagement in learning. Research has found an important link between student engagement and learning, including relationships with persistence (Berger & Milem, 1999; Kuh, Cruse, Shupe et al., 2008), satisfaction (Filak & Sheldon, 2008; Zimmerman & Kitsantas, 1997), and academic achievement (Hughes, Luo, Kwok, & Loyd, 2008; Kuh, Kinzie, Buckley, Bridges, & Hayek, 2007; Ladd & Dinella, 2009; Nystrand & Gamoran, 1991; Skinner, Wellborn, & Connell, 1990).
Researchers have identified blended learning as having potential to enhance and increase student engagement (Dzuiban, Hartman, Cavanagh, & Moskal, 2011; Graham & Robison, 2007; Shea & Bidjerano, 2010). Recent meta-analyses have shown that blended and online learning, when compared to face-to-face instruction, have experienced greater gains in student performance and satisfaction (Bernard et al., 2009; Means, Toyama, Murphy, & Baki, 2013). This is evidence that blended and online learning may enhance student engagement. However, little is known about what is leading to the observed increase in gains (Means et al., 2013). Understanding the operational principles or core attributes of a learning experience that enable greater student engagement, performance, and satisfaction will be important to the future design of effective blended and online learning (Graham, Henrie, & Gibbons, 2014).
To understand how blended and online learning enables greater student engagement, we need useful measures of student engagement (see Oncu & Cakir, 2011). Most approaches to measuring student engagement involve a single or aggregate self-report measure (Fredricks & McCloskey, 2012; Henrie, Halverson, & Graham, 2015). A more granular, longitudinal approach to measuring student engagement could enable understanding of how the various elements of a blended or online learning experience impact student engagement. With this understanding, we could better identify and improve instructional events and attributes that lead to changes in student engagement. This study reports on an exploration of more granular approaches to measuring student engagement, specifically through the use of intensive longitudinal measures.
Student engagement is defined in multiple ways, ranging from students’ effort and persistence to their emotional involvement, use of metacognitive strategies, and motivation to learn (Fredricks, Blumenfeld, & Paris, 2004; Fredricks & McCloskey 2012; Reschly & Christenson, 2012). We define engagement as the quantity and quality of cognitive and emotional energy students exert to learn (see Skinner & Pitzer, 2012; Russell, Ainley, & Frydenberg, 2005). Cognitive energy is the student’s application of mind to attend to learning; it includes such indicators as attention and effort, but also cognitive and metacognitive strategy use. Emotional energy refers to the emotional experience students have while learning, such as experiencing interest, enjoyment, or satisfaction. Negative emotional experiences, such as boredom, frustration, or confusion, could indicate levels of disengagement. We believe the dynamic between cognitive and emotional energy impacts learning outcomes of interest in different ways (see Skinner, Kindermann, & Furrer, 2008), though future research is needed to better understand this relationship (Janosz, 2012).
Student engagement has been measured in blended and online learning experiences in multiple ways. In our review of the research, self-report methods were most common. A popular self-report measure is the National Survey of Student Engagement developed by Indiana University (see Kuh, 2001), which has been used to evaluate design and study the relationship between student engagement and other important academic outcomes (e.g. Chen, Lambert, & Guidry, 2010; Junco, Heiberger, & Loken, 2011; Neumann & Hood, 2009). Self-report methods can be an effective and scalable approach to studying student engagement in online and face-to-face, though some feel the approach disrupts the behavior and experiences that are intended to be studied (Baker et al., 2012). Other studies have turned to more direct, though less scalable, approaches to study student engagement, such as using direct, video, or screen capture observations of students’ behavior while learning (Figg & Jamani, 2011; Bluemink & Järvelä, 2004; Lehman, Kauffman, White, Horn, & Bruning, 2001).
One observational approach to studying student engagement that is more scalable than using human observation is the use of user behavior data captured by educational learning systems, such as intelligent tutoring systems (Arroyo, Murray, Woolf, & Beal, 2004; Baker, et al., 2012; Woolf et al., 2009), learning management systems (Beer, Clark, & Jones, 2010; Cocea & Weibelzahl, 2011; Morris, Finnegan, & Wu, 2005), and other educational software (Baker & Ocumpaugh, 2014). For example, Macfadyen & Dawson (2010) investigated log data of five biology courses obtained from a learning management system to determine which engagement factors best predict academic success. Thirteen variables were found to have a statistically significant correlation with students’ final grades (p < .01), including total number of discussion messages posted, total time online, and the number of web links viewed. This type of data is a potentially rich source of student engagement data, providing information about changes in behavior in minutes and seconds. Such data would be near impossible for people to track and record manually.
One interesting research approach recently applied to educational research is intensive longitudinal research methods (ILM). ILM, like other longitudinal methods, involve collecting enough data points for an individual over time. The difference between ILM from other longitudinal methods is the narrowed scope of time that data is collected. Other longitudinal approaches collect data once a month or once a year over several years, whereas ILM studies collect data every few hours or days, with studies conducted over a much shorter time frame. ILM is particularly useful for measuring individual states like mood (excitement, boredom, etc.), that fluctuate at a more granular level than other factors, such as socio-economic status or standardized test scores. ILM also places particular emphasis on contextual factors like location (online or face-to-face) and type of activity (lecture, discussion, etc.).
Intensive longitudinal methods have been successful in educational settings. The experience sampling method (ESM), a popular version of ILM, involves having students answer a one-page survey seven to eleven times a day for a week, providing a rich understanding of everyday teenage life, particularly students’ classroom experiences (Hektner, Schmidt, & Csikszentmihalyi, 2007). Using an ESM design, Park, Halloway, Arendtsz, Bempechat, and Li (2012) found that students “not only experienced changing levels of engagement from situation to situation, but also displayed a distinct trajectory of engagement compared with other students” (p. 396). Shernoff and Schmidt (2008) found that contextual factors affected engagement differently for different ethnic groups of students. According to Csikszentmihalyi (2012), “If we wish to know how and when students focus their attention on school work—and especially when they do so effectively—the ESM and related methods are again our choice” (p. xv).
Intensive longitudinal research methods, as far as we are aware, have not been used to study student engagement in a blended or online context. Other studies of student engagement in blended and online learning, whether self-report, human observation, or log data were used, reported on student engagement as a single or aggregate measure. A longitudinal approach would provide a richer description of changes in student engagement across time. We feel this method is particularly relevant to research in blended and online learning as these instructional methods include an array of approaches to designing a learning experience. By using ILM, we assume that a learning experience comes as a package, where individual parts have varying impact on student engagement. ILM allows us to capture data in a way where we can better understand how the elements and sequence of elements in a learning experience uniquely impact student engagement.
In this study, we explored intensive longitudinal measures of student engagement in blended learning and examine what this type of information can tell us about the relationship between instructional design and student engagement. We used both self-report and behavioral data to measure engagement. By using this approach, we believe we can more capably study how instructional design impacts student engagement, potentially leading to design decisions that could improve student retention, academic performance, and satisfaction in blended and online learning.
Our study took place in 2014 in a blended undergraduate course in educational technology, with 20 students electing to participate (19 females and 1 male). Students were between 18-30 years of age, in their junior and senior years, and majoring in elementary education. All students had previous experience with blended learning. The course was a technology education course designed to introduce students to technologies that help improve content delivery and course management, and to help students develop skills to effectively evaluate educational technologies. Students met in class once a week seven times during the 14-week semester. The majority of course work was project based. On weeks when students did not meet in class, time was given to complete projects or meet with the instructor for help. Course materials and assignments were delivered using the Canvas learning management system (LMS). During the latter portion of the semester, students participated in a month-long practicum experience, applying what they had learned in the course in an elementary classroom.
We measured student engagement using two types of measures: surveys of students’ perceptions of the learning activity and user activity on the LMS recorded as log data. Surveys of student perceptions of the learning experience were used to indicate emotional energy, while patterns of behavior on the LMS were used as indicators of cognitive energy. We describe our rationale and approach for these two measures below. In addition to engagement data, we recorded academic performance on individual assignments and final grades for the whole course. We conducted exploratory analysis on these data with an intensive longitudinal approach—structuring, visualizing, and analyzing the data in multiple ways and examining patterns and differences among participants.
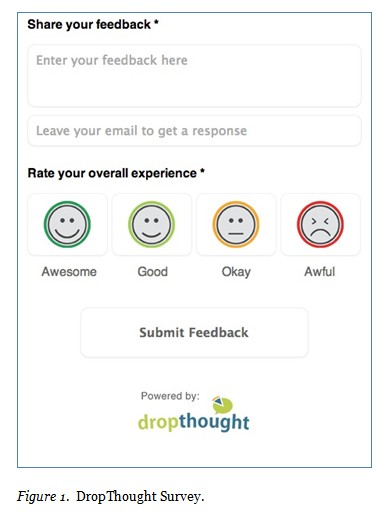
We had students complete a simple survey rating their learning experience and providing feedback. The system of survey and administration was designed by DropThought, a private company specializing in feedback services. Students rated their learning experience using a four-point emoticon scale (see Figure 1) using the following options: awesome, good, okay, or awful. An open-ended text field was also provided for students’ additional feedback about their learning experience. DropThought surveys could be accessed from either a mobile app or web widget embedded in the LMS. Students were asked to complete DropThought surveys nine times during the semester: five times during face-to-face class meetings, three times after completing online activities, and once during practicum.
We first used DropThought survey data to create the usual class level analysis of engagement, computing average emotional engagement scores for the course and for face-to-face and online learning activities. To explore the possibility of a unique engagement process for individual students, we graphed each student’s engagement scores throughout the course and then compared individual engagement patterns to the class average. Finally, we examined and coded the qualitative data generated by the open-ended survey question. Continuing the exploratory nature of this study, we focused on two students’ experiences in depth. We chose the two students based on the diversity of their experiences in the class and the potential to illustrate how activity level longitudinal data can illuminate moments of engagement.
We extracted user activity data from the LMS application programing interface (API), including webpage views and time stamps for each student in the course. To estimate the amount of time a student spent on a page, we subtracted the timestamp for the page from the timestamp for the following page. As we reviewed the data, we found that some time-spent calculations were multiple hours to multiple days in length. This occurred because Canvas did not record when students left the LMS. When a student returned to the LMS hours or days later, Canvas would record a new timestamp once the student moved to a different page. To develop a more accurate measure of time-spent for page views occurring before a long session of inactivity, we replaced the final page view of a session with the average amount of time spent on similar pages on the LMS. While this was not a completely accurate measure, it seemed a reasonable approach for estimating time spent on a page.
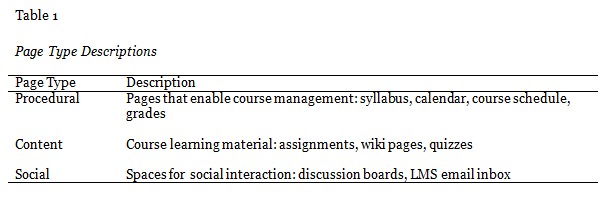
After extracting the data, we categorized types of page views with an interaction framework used by various researchers (Borup, Graham, & Davies, 2013; Hawkins, Graham, Sudweeks, & Barbour, 2013; Heinemann, 2005), consisting of three types of interaction: procedural, content, and social (see Table 1). This framework allowed us to better determine when students were most likely learning for the course, rather than reviewing the syllabus or checking their grades. We visualized and analyzed data in multiple ways to identify meaningful patterns of engaged behavior during the semester. We also compared log data patterns to students’ DropThought responses to explore potential relationships.
In addition to categorizing and visualizing page views, we organized the data into sessions, re-creating the sequence of actions that occurred during the session and analyzing this information longitudinally. Because of the amount of data and the time necessary to complete this process, we applied this level of analysis only for three students that represented a range of experiences of students who did and did not successfully complete the course. Our final selection included Suzy, who stopped her course work half way through the semester and ultimately failed; Rachel, who got a perfect grade in the class and did so with fewer page views than most students (308 page views); and Anne, who got an almost perfect score but had more page views than most students (549 page views). Sessions were determined for these three students by identifying the major breaks of inactivity on the LMS. Sessions included the first page of returned activity to the last page of activity.
With sessions identified, we then retraced each student’s steps to get a better sense of what was happening in each session. We compiled this information into session narratives for log data corresponding to the first seven weeks of class, as this was the most time Suzy worked consistently on the LMS. With this data, we looked for patterns that could indicate engagement or disengagement.
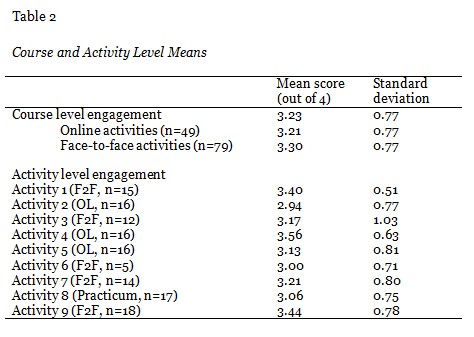
Despite collecting only two simple data pieces—a numerical satisfaction rating and an open response feedback statement—we found interesting results with DropThought. The richness of the data was attributable directly to its being longitudinal. To compare the traditional course level engagement data with the longitudinal data, we computed course and activity engagement measures, shown in Table 2. Based on averaging all the DropThought scores, the mean level of emotional engagement for this course was 3.25 out of a possible 4 points (4=Awesome, 3=Good, 2=Okay, 1=Awful), the mean for online activities was 3.24, and the mean for face-to-face activities was 3.31 (see Table 2). Means for each activity are also shown in the table. Longitudinal activity-level data reveal that the first and the last class have the highest ratings. Furthermore, the ratings for the first class have the least variance. Also of interest is that the first online class has the lowest rating, possibly indicating student unease in switching to this mode for the first time.
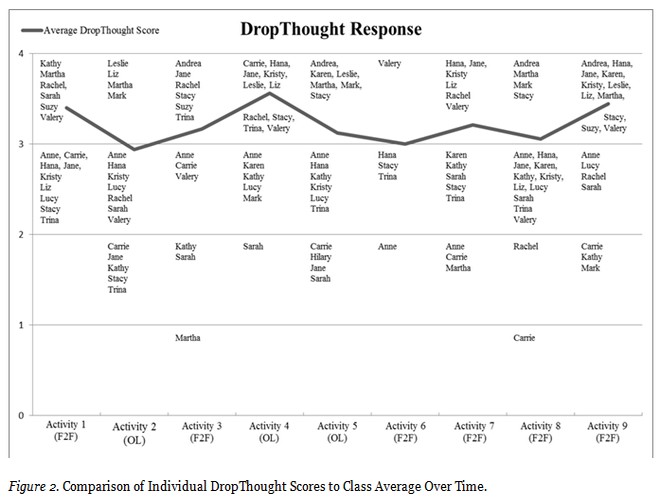
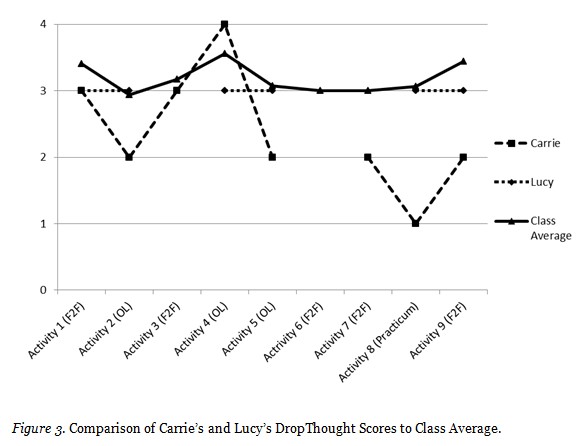
For each measurement reported in Table 2, the focus of analysis was the course or activity. However, this research also explored the possibility of using longitudinal data to focus analysis on individual learners interacting with specific learning activities. Charting the longitudinal responses for the students allowed us to see their pattern or “journey” through the course. Figure 2 depicts how individual students rated each activity contrasted with the class average for those activities. This figure illustrates that each student had a unique experience in this course in terms of reported emotional engagement score. The small sample size did not allow us to establish the statistical significance of this variance in intercept or slope. After charting all of the students, we focused our analysis on two: Carrie, who showed the most variance in her ratings, and Lucy, who had the least variance— rating every activity as 3 (good). The engagement patterns for these two students are contrasted with the class average (see Figure 3).
By connecting the two students’ coded comments with their activity rating, we were able to create a simple case study. This analysis led to several important findings. First, Carrie’s engagement appeared to be closely related to her perception of relevance and autonomy. She gave the eighth activity the lowest rating of one (Awful). Part of her feedback included, “I feel like the technology used is more of a hindrance than a resource in my lesson planning.” She definitely did not feel as though the activity was relevant to her practicum experience. In contrast, she gave the fourth activity the highest rating of 4 (Awesome) and said, “I liked having independent time to just look over a resource and see how it applied to the curriculum.” Her comments also revealed an interesting dynamic that may be unique to blended learning courses.
Her comment on the last activity, which was face to face, started with “I could have done this with a video tutorial, so I wasn’t sure why I needed to come to class.” Possibly, instructors who guide students through successful online activities face an increased expectation to justify the time and effort required for students to attend class.
Analysis of Lucy’s comments showed that although she rated every activity 3 (good), her engagement level was not the same throughout the course. She seemed to have “high 3s” and “low 3s.” Her comments, like Carrie’s, suggested increased satisfaction when she perceived greater relevance and autonomy. For example, after Activity 4 she stated, “I liked that we got to choose our own technology. . . . The personalized instructions were good, but I thought it was a little confusing.” Autonomy and relevance have been theorized to be two very important elements associated with engagement (see Fredricks & McCloskey, 2012; Skinner & Pitzer, 2012).
We began exploratory analysis of the log data by looking at differences in student activity on the LMS over the entire semester, particularly the number of page views and amount of time spent in the LMS. Table 3 summarizes the distributions of page views, time spent, and final course grade. For a mastery-based course on an upper undergraduate level, final grades showed little variation. The mean grade in the class was 96.19%. However, we found considerable variation among students in total number of page views and time spent on the course (see Table 3). This finding is not surprising for a mastery-based class, as time is flexible and revision is encouraged (see Reigeluth, 1999). Thus the number of page views or time spent would not indicate academic success or engagement variation throughout the course. To better understand student engagement in terms of LMS activity data, we explored in longitudinal rather than aggregate data form.

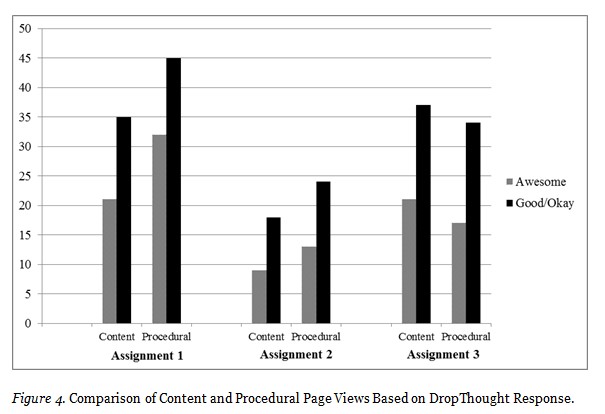
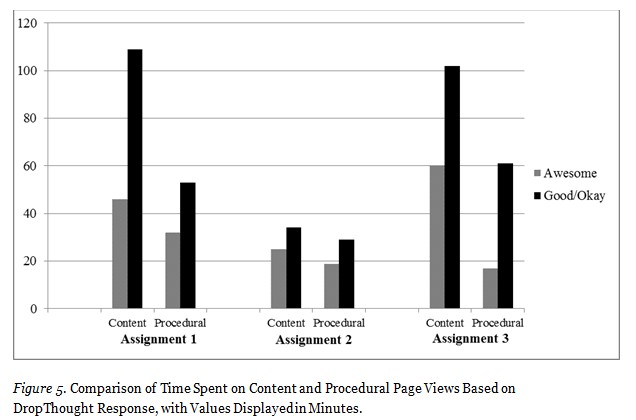
Moving to a more granular analysis of log data, we investigated the relationship between DropThought survey responses and log data from three online assignments. Because students’ DropThought responses were assignment specific, we isolated the log data pertinent to each assignment connected with the DropThought requests, taking log data from the submission point of the previous assignment to the submission point of the target assignment. We further organized the data according to the framework of procedural, social, and content pages to investigate the importance of different types of page views.
In visualizing the data, we found that many students who rated an assignment as good or okay had, on average, used more page views and spent more time on pages than those who rated the assignment as awesome (see Figures 4 and 5). DropThought responses from the three online assignments reveal some possible reasons for these differences. Some students experienced technical difficulties in completing the assignment. One student said, “It took me a little over 30 minutes to figure out what to do to make my technology work.” Students struggling to get the technology to function may be spending more time on pages as they troubleshoot. Others experiencing technical difficulties may leave the assignment and come back to it later hoping the technology issues will be resolved, causing them to have more page views than otherwise.
Another reason less satisfied students may require additional time and page views could be boredom or lack of perceived relevance. Students comments included the following: “I wasn’t too crazy about the . . . assignment,” and “I just still struggle seeing the merit.” Repeatedly starting and stopping an assignment due to lack of motivation or interest could result in higher page view counts. Some less satisfied students requested clearer or additional directions: “It would have been more helpful to me if we had more info on how we should do it,” and “I would have liked maybe a little more direction.” These students may have spent more time on content pages trying to better understand instructions or may have been searching the LMS for additional resources that might help them succeed on the assignment, leading to more procedural page views.
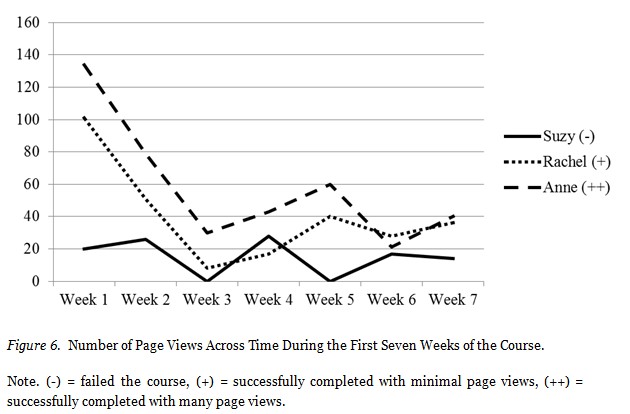
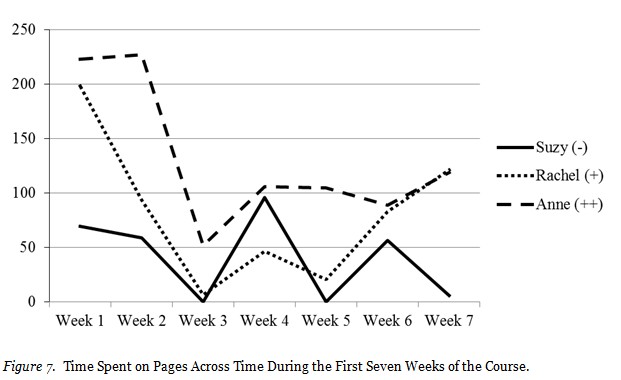
Our final analysis was to longitudinally review the session narratives of three students to identify engagement patterns that might indicate students at risk for dropping out of a course. We reviewed the session narratives for Suzy (who dropped out after week seven), Rachel (who successfully completed the course with fewer page views than the average), and Anne (who successfully completed the course but with more page views than the average). In the review process we noticed a great deal of difference in activity on the LMS between Suzy and the other two students for the first week of the course, with Suzy having significantly fewer page views and less time spent (see Figures 6 and 7). This difference decreased as the course progressed.
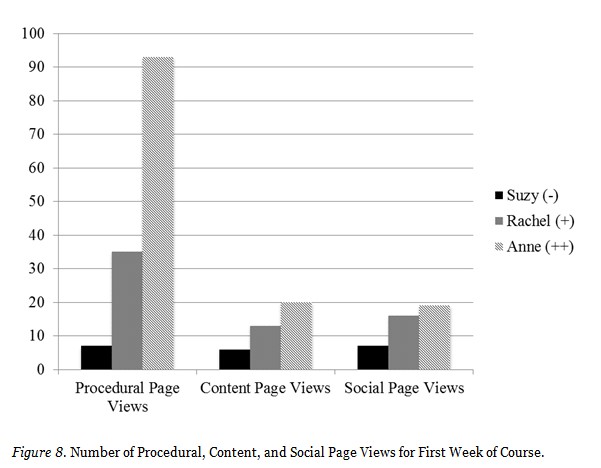
The biggest difference between Suzy and the two more successful students the first week of the course was that Rachel and Anne had much higher numbers of procedural page views than Suzy (see Figure 8). The session narratives showed that Rachel and Anne had both spent time the first week exploring the LMS, checking out features such as the internal email system, the calendar, discussion boards, quizzes, and the syllabus. In addition to exploring the LMS, Rachel and Anne also spent time previewing assignments beyond those due the first week of class. Suzy, however, spent her first week visiting only those pages of assignments due the first week of the course. As this semester was the first time many students had used Canvas, Suzy may have dropped out partly because she did not fully understand how to use the LMS, specifically being unable to follow the class schedule or locate assignments and resources.
Our review of session narratives also showed that Rachel and Anne continued to preview upcoming assignments beyond the first week of the course. This was often done a few days to a week before the due date. As we reviewed activity data for all students in the course, we found that most tended to work close to due dates. Rachel’s and Anne’s session narratives hint that work occurring right before the due date might have been planned strategically in advance. By visiting upcoming assignment pages, they might have assessed the amount of time and effort needed to successfully complete the assignment and scheduled it. We counted how often the three students viewed assignment pages at least 24 hours before the due date (for five seconds or longer) during the first seven weeks of the semester. We found that Rachel had 17 assignment preview pages, Anne had 24, and Suzy had 2. Employing this learning strategy may indicate a higher degree of cognitive engagement, which we would term as quality cognitive energy. We hope to investigate the relationship between this behavior and learning outcomes on a larger scale in future studies. If there is a strong relationship, previewing may be an early indicator for students at risk for dropout.
Our purpose was to explore different approaches to measuring student engagement in a blended course at a granular level. Because we chose an intensive longitudinal approach, using self-report and observational measures, we were able to see variance in student engagement across activities both at the group level and among individuals. We were also able to explore new indicators of student engagement and to learn important lessons about research in blended and online learning.
Engagement is a broad theoretical construct, defined by some as amount of activity in a course and by others to represent quality emotions and behaviors that lead to student success (see Fredricks & McCloskey, 2012). Looking at the number of pages or amount of time spent on the LMS fits well with an effort approach to student engagement; however, we found this indicator problematic. At times it seemed appropriate to indicate success, but at other times, especially at a granular level, the relationship did not hold up well. For instance, Suzy, who did not complete the course, spent more time on assignments or had more page views than successful students. Even the successful students differed in the effort applied to learning. With more data, perhaps a baseline could be determined for amount of effort necessary to succeed in a course. However, in determining who is at risk for dropout or failure, the amount of effort as measured by time spent or number of pages viewed in the learning management system may not be adequate to discern engagement and potential academic success.
We identified indicators we consider as quality effort, which are worth exploring at a larger scale. In defining quality effort, we could consider the different ways students read textbooks. Some students may read all assigned textbook pages. This effort is good. However, highlighting important passages, looking up definitions of unfamiliar words, and writing summaries and syntheses of reading assignments is better, and likely to lead to improved learning outcomes.
One possible evidence of quality effort is taking time to review upcoming assignments. Doing this does not guarantee success, as students may underestimate the time and effort necessary to succeed in a learning activity. However, the acts of looking ahead and planning suggest the intention to persist and succeed in a course, a metacognitive strategy often tied to cognitive engagement (Finn & Zimmer, 2012; Fredricks, Blumenfeld, & Paris, 2004). Additionally, becoming familiar with course learning tools can be considered quality effort. A student unfamiliar with a learning management system may not know how to find a course schedule outlining assignments and due dates, and thus will get behind and not succeed in learning. We should not expect students to figure out course tools on their own (see Weimer, 2013). Helping students become familiar with learning tools could increase the success of all students. However, after specific instruction on using the course learning tools, students who do not visit important course pages may be showing either a lack of motivation or a persistent difficulty in grasping the use of the tool. Early alert systems that track student activity could make use of this indicator to help instructors identify who needs help.
Exploring these different measures of student engagement showed us the limitations of comparing face-to-face learning, online learning and blended learning in terms of student satisfaction and academic success. Having tracked students’ DropThought responses across multiple activities in both face-to-face and online contexts, we found that often the difference is not the medium of instruction, but how the medium is used. The reason for student satisfaction may be totally irrelevant to the medium. In our study, online learning activities had both lower and higher class average DropThought scores than face-to-face activities. Clearly, the design of the activity matters more than the medium. As we reviewed the open-ended text feedback, we found that the clarity of the instructions and relevance of the activity strongly impacted student satisfaction.
Future blended and online learning research should look beyond what Graham et al. (2014) referred to as the physical layer of instruction (whether learning occurred face-to-face or online) and focus on the pedagogical layer—the core attributes of a design most likely to affect instructional success (see also Means et al., 2013). Intensive longitudinal methods, as explored in this study, have strong potential to increase understanding of the relationship between core attributes and student engagement. Activity-level measures enable us to identify relationships between types of learning activities and types of engagement (e.g., emotional, cognitive). For example, important patterns may be identified between levels of students’ emotional engagement and face-to-face collaborative activities. With this lead, we can further investigate what core attributes behind these face-to-face activities increase or decrease student engagement by manipulating certain aspects of the design. We can also investigate how sequencing of activities impacts engagement by capturing moment-to-moment and activity-to-activity data. This type of work can lead to more detailed and research-supported theory for designing instruction that effectively impacts student engagement. Important to this research will be increased understanding of how characteristics of the learner impact student engagement along with the interaction between design and learner characteristics (Lawson & Lawson, 2013).
While our intensive longitudinal approach provided useful perspective and understanding not attainable by looking at course-level aggregate data alone, this type of research can be difficult to scale. Extracting log data produced by learning management systems makes available large quantities of data which, even at a small scale, are time-consuming to look through manually as done in this study. However, by following our manual approach, we were able to identify potentially useful engagement indicators that can be investigated in future work through computer-automated analysis. More research using this approach at a small scale could continue to uncover meaningful engagement indicators from log data.
Additionally, our inferences about student activity on a page were limited to available data. We were unable to completely determine how much time students spent on all pages in the LMS and whether activity was actually occurring on each page. We plan to investigate the potential of mouse-tracking for collecting more real-time data of activity on a page. Finally, our self-report survey provided limited information about student engagement, especially in improving our understanding of the emotional experience students have while learning. We will address this issue in a future study by developing a more sophisticated instrument that measures both cognitive and emotional engagement indicators and is short enough to use multiple times in a course without being too burdensome to participants. We hope this work contributes to understanding how blended and online course designs impact student engagement across time. Such work will help us to develop theory of how to design learning experiences that best lead to high student engagement.
Annetta, L. a., Minogue, J., Holmes, S. Y., & Cheng, M.-T. (2009). Investigating the impact of video games on high school students’ engagement and learning about genetics. Computers & Education, 53, 74–85. doi:10.1016/j.compedu.2008.12.020
Arroyo, I., Murray, T., Woolf, B. P., & Beal, C. (2004). Inferring unobservable learning variables from students’ help seeking behavior. In Proceedings of 7th International Conference on Intelligent Tutoring Systems (pp. 782–784). Maceió, Alagoas, Brazil. doi:10.1007/978-3-540-30139-4_74
Baker, R. S. J., Gowda, S. M., Wixon, M., Kalka, J., Wagner, A. Z., Aleven, V., . . . Rossi, L. (2012). Towards sensor-free affect detection in cognitive tutor algebra. In K. Yacef, O. Zaïane, H. Hershkovitz, M. Yudelson, & J. Stamper (Eds.), Proceedings of the 5th International Conference on Educational Data Mining (pp. 126–133). Chania, Greece. Retrieved from http://educationaldatamining.org/EDM2012/index.php?page=proceedings
Baker, R. S. J., & Ocumpaugh, J. (2014). Cost-effective, actionable engagement detection at scale. In J. Stamper, Z. Pardos, M. Mavrikis, & B. M. McLaren (Eds.), Proceedings of the 7th International Conference on Educational Data Mining (Vol. 348, pp. 345–346). London, UK. Retrieved from http://www.columbia.edu/~rsb2162/EDM2014-Detector Cost-v8jlo.pdf
Beer, C., Clark, K., & Jones, D. (2010). Indicators of engagement. In Proceedings of ASCILITE 2010 (pp. 75–86). Sydney, Australia. Retrieved from http://ascilite.org.au/conferences/sydney10/procs/Beer-full.pdf
Berger, J. B., & Milem, J. F. (1999). The role of student involvement and perceptions of integration in a causal model of student persistence. Research in Higher Education, 40(6), 641–664. Retrieved from http://link.springer.com/article/10.1023/A%3A1018708813711
Bernard, R. M., Abrami, P. C., Borokhovski, E., Wade, C. a., Tamim, R. M., Surkes, M. a., & Bethel, E. C. (2009). A meta-analysis of three types of interaction treatments in distance education. Review of Educational Research, 79(3), 1243–1289. doi:10.3102/0034654309333844
Bluemink, J., & Järvelä, S. (2004). Face-to-face encounters as contextual support for Web-based discussions in a teacher education course. The Internet and Higher Education, 7, 199–215. doi:10.1016/j.iheduc.2004.06.006
Borup, J., Graham, C., & Davies, R. (2013). The nature of parental interactions in an online charter school. American Journal of Distance Education, 27(1), 40-55.
Bulger, M. E., Mayer, R. E., Almeroth, K. C., & Blau, S. D. (2008). Measuring learner engagement in computer-equipped college classrooms. Journal of Educational Multimedia and Hypermedia, 17(2), 129–143.
Chen, P. D., Lambert, A. D., & Guidry, K. R. (2010). Engaging online learners: The impact of Web-based learning technology on college student engagement. Computers & Education, 54, 1222–1232. doi:10.1016/j.compedu.2009.11.008
Cocea, M., & Weibelzahl, S. (2011). Disengagement detection in online learning: Validation studies and perspectives. IEEE Transactions on Learning Technologies, 4, 114–124. doi:10.1109/TLT.2010.14
Csikszentmihalyi, M. (2012). Preface. In M. R. Mehl & T. S. Conner (Eds.), Handbook of research methods for studying daily life (pp. xi-xvii). New York: NY: Guilford Press.
Dziuban, C. D., Hartman, J. L., Cavanagh, T. B., & Moskal, P. D. (2011). Blended courses as drivers of institutional transformation. In A. Kitchenham (Ed.), Blended learning across disciplines: Models for implementation (pp. 17–37). Hershey, PA: IGI Global.
Eccles, J., & Wang, M.-T. (2012). Part 1 Commentary: So what is student engagement anyway? In S. Christenson, A. Reschley, & C. Wylie (Eds.), Handbook of research on student engagement (pp. 133–145). New York, NY: Springer US.
Figg, C., & Jamani, K. J. (2011). Exploring teacher knowledge and actions supporting technology-enhanced teaching in elementary schools: Two approaches by pre-service teachers. Australasian Journal of Educational Technology, 27, 1227–1246. Retrieved from http://ascilite.org.au/ajet/ajet27/figg.html
Filak, V. F., & Sheldon, K. M. (2008). Teacher support, student motivation, student need satisfaction, and college teacher course evaluations: Testing a sequential path model. Educational Psychology, 28(6), 711–724. doi:10.1080/01443410802337794
Finn, J. D., & Zimmer, K. S. (2012). Student engagement: What is it? Why does it matter? In S. L. Christenson, A. L. Reschly, & C. Wylie (Eds.), Handbook of research on student engagement (pp. 97–131). Boston, MA: Springer US.
Fredricks, J. A., Blumenfeld, P. C., & Paris, A. H. (2004). School engagement: Potential of the concept, state of the evidence. Review of Educational Research, 74(1), 59–109. Retrieved from http://rer.sagepub.com/content/74/1/59.short
Fredricks, J. A., & McColskey, W. (2012). The measurement of student engagement: A comparative analysis of various methods and student self-report instruments. In S. L. Christenson, A. L. Reschly, & C. Wylie (Eds.), Handbook of research on student engagement (pp. 763–782). Boston, MA: Springer US.
Garcia, I., & Pena, M. I. (2011). Machine translation-assisted language learning: Writing for beginners. Computer Assisted Language Learning, 24(5), 471–487. doi:10.1080/09588221.2011.582687
Graham, C. R., Henrie, C. R., & Gibbons, A. S. (2014). Developing models and theory for blended learning research. In A. G. Picciano, C. D. Dziuban, & C. R. Graham (Eds.), Blended learning: Research perspectives (Vol. 4, pp.13–33). New York, NY: Routledge.
Graham, C. R., & Robison, R. (2007). Realizing the transformational potential of blended learning: Comparing cases of transforming blends and enhancing blends in higher education. In Anthony G. Picciano & Charles D. Dziuban (Eds.), Blended Learning: Research Perspectives (pp. 83–110). Needham, MA: The Sloan Consortium.
Hawkins, A., Graham, C. R., Sudweeks, R. R., & Barbour, M. K. (2013). Academic performance, course completion rates, and student perception of the quality and frequency of interaction in a virtual high school. Distance Education, 34(1), 64–83. doi:10.1080/01587919.2013.770430
Handelsman, M. M., Briggs, W. L., Sullivan, N., & Towler, A. (2005). A measure of college student course engagement. The Journal of Education, 98(3), 184–191.
Heinemann, M. H. (2005). Teacher-student interaction and learning in online theological education. Part II: Additional theoretical frameworks. Christian Higher Education, 4(4), 277–297. doi:10.1080/15363750500182794
Hektner, J. M., Schmidt, J. A., & Csikszentmihalyi, M. (2007). Experience sampling method: Measuring the quality of everyday life. Thousand Oaks, CA: Sage.
Henrie, C. R., Halverson, L. R., & Graham, C. R. (2015). Measuring student engagement in technology-mediated learning: A review. Submitted for publication.
Hughes, J. N., Luo, W., Kwok, O.-M., & Loyd, L. K. (2008). Teacher-student support, effortful engagement, and achievement: A 3-year longitudinal study. Journal of Educational Psychology, 100(1), 1–14. doi:10.1037/0022-0663.100.1.1
Janosz, M. (2012). Part IV commentary: Outcomes of engagement and engagement as an outcome: Some consensus, divergences, and unanswered questions. In S. L. Christenson, A. L. Reschly, & C. Wylie (Eds.), Handbook of research on student engagement (pp. 695-703). Boston, MA: Springer US. doi:10.1007/978-1-4614-2018-7_33
Junco, R., Heiberger, G., & Loken, E. (2011). The effect of Twitter on college student engagement and grades. Journal of Computer Assisted Learning, 27(2), 119–132. doi:10.1111/j.1365-2729.2010.00387.x
Kuh, G. D. (2001). Assessing what really matters to student learning: Inside the National Survey of Student Engagement. Change: The Magazine of Higher Learning, 33(3), 10–17. Retrieved from http://heldref-publications.metapress.com/index/1031675L274X4106.pdf
Kuh, G. D., Cruce, T. M., Shoup, R., Kinzie, J., Gonyea, R. M., & Gonyea, M. (2008). Unmasking the effects of student on first-year college engagement grades and persistence. The Journal of Higher Education, 79(5), 540–563.
Kuh, G. D., Kinzie, J., Buckley, J. A., Bridges, B. K., & Hayek, J. C. (2007). Piecing together the student success puzzle: Research, propositions, and recommendations. ASHE Higher Education Report, 32(5), 1–182. doi:10.1002/aehe.3205
Ladd, G. W., & Dinella, L. M. (2009). Continuity and change in early school engagement: Predictive of children’s achievement trajectories from first to eighth grade? Journal of Educational Psychology, 101(1), 190–206. doi:10.1037/a0013153
Lawson, M. a., & Lawson, H. a. (2013). New conceptual frameworks for student engagement research, policy, and practice. Review of Educational Research, 83, 432–479). doi:10.3102/0034654313480891
Lehman, S., Kauffman, D. F., White, M. J., Horn, C. A., & Bruning, R. H. (2001). Teacher interaction: Motivating at-risk students in web-based high school courses. Journal of Research on Computing in Education, 33(5), 1–20. Retrieved from http://216.14.219.22/motivation.pdf
Macfadyen, L. P., & Dawson, S. (2010). Mining LMS data to develop an “early warning system” for educators: A proof of concept. Computers & Education, 54(2), 588–599. doi:10.1016/j.compedu.2009.09.008
Means, B., Toyama, Y., Murphy, R. F., & Baki, M. (2013). The effectiveness of online and blended learning : A meta-analysis of the empirical literature. Teachers College Record, 115(3). Retrieved from http://www.tcrecord.org/library
Morris, L. V., Finnegan, C., & Wu, S.-S. (2005). Tracking student behavior, persistence, and achievement in online courses. The Internet and Higher Education, 8(3), 221–231. doi:10.1016/j.iheduc.2005.06.009
Neumann, D. L., & Hood, M. (2009). The effects of using a wiki on student engagement and learning of report writing skills in a university statistics course. Australasian Journal of Educational Technology, 25, 382–398. Retrieved from http://ascilite.org.au/ajet/submission/index.php/AJET/article/view/1141
Nystrand, M., & Gamoran, A. (1991). Instructional discourse, student engagement, and literature achievement. Research in the Teaching of English, 25(3), 261–290. Retrieved from http://www.jstor.org/stable/10.2307/40171413
Oncu, S., & Cakir, H. (2011). Research in online learning environments: Priorities and methodologies. Computers & Education, 57(1), 1098–1108. doi:10.1016/j.compedu.2010.12.009
Park, S., Holloway, S. D., Arendtsz, A., Bempechat, J., & Li, J. (2012). What makes students engaged in learning? A time-use study of within- and between-individual predictors of emotional engagement in low-performing high schools. Journal of Youth and Adolescence, 41(3), 390–401. doi:10.1007/s10964-011-9738-3
Parsad, B., & Lewis, L. (2008). Distance education at degree-granting postsecondary institutions: 2006-07. Washington DC: Department of Education. Retrieved from http://nces.ed.gov/pubs2009/2009044.pdf
Patterson, B., & McFadden, C. (2009). Attrition in online and campus degree programs. Online Journal of Distance Learning Administration, 12(2). Retrieved from http://www.westga.edu/~distance/ojdla/summer122/patterson112.html
Picciano, A. G., Seaman, J., Shea, P., & Swan, K. (2012). Examining the extent and nature of online learning in American K-12 education: The research initiatives of the Alfred P. Sloan Foundation. The Internet and Higher Education, 15(2), 127–135. doi:10.1016/j.iheduc.2011.07.004
Reschly, A. L., & Christenson, S. L. (2012). Jingle, jangle, and conceptual haziness: Evolution and future directions of the engagement construct. Handbook of research on student engagement. Retrieved from http://www.springerlink.com/index/X0P2580W60017J14.pdf
Reigeluth, C. M. (1999) What is instructional design theory and how is it changing? In C. M. Reigeluth (Ed.), Instructional-design theories and models: A new paradigm of instructional theory (Vol. 2, pp. 5-29). Mawah, NJ: Lawrence Erlbaum Associates.
Rice, K. L. (2006). A comprehensive look at distance education in the K-12 context. Journal of Research on Technology in Education, 38(4), 425–449.
Roblyer, M. D. (2006). Virtually successful: Defeating the dropout problem through online programs. The Phi Delta Kappan, 88(1), 31–36.
Russell, J., Ainley, M., & Frydenburg, E. (2005). School issues digest: Motivation and engagement. Canberra, Australia: Australian Government, Department of Education, Science and Training.
Shea, P., & Bidjerano, T. (2010). Learning presence: Towards a theory of self-efficacy, self-regulation, and the development of a communities of inquiry in online and blended learning environments. Computers & Education, 55(4), 1721–1731. doi:10.1016/j.compedu.2010.07.017
Shernoff, D. J., & Schmidt, J. a. (2007). Further evidence of an engagement-achievement paradox among U.S. high school students. Journal of Youth and Adolescence, 37(5), 564–580. doi:10.1007/s10964-007-9241-z
Skinner, E. A., Kindermann, T. A., & Furrer, C. J. (2009). A motivational perspective on engagement and disaffection: Conceptualization and assessment of children’s behavioral and emotional participation in academic activities in the classroom. Educational and Psychological Measurement, 69(3), 493–525. doi:10.1177/0013164408323233
Skinner, E. A., & Pitzer, J. R. (2012). Developmental dynamics of student engagement, coping, and everyday resilience. In S. L. Christenson, A. L. Reschly, & C. Wylie (Eds.), Handbook of research on student engagement (pp. 21–44). Boston, MA: Springer US. doi:10.1007/978-1-4614-2018-7
Skinner, E. A., Wellborn, J. G., & Connell, J. P. (1990). What it takes to do well in school and whether I’ve got it: A process model of perceived control and children’s engagement and achievement in school. Journal of Educational Psychology, 82(1), 22–32. doi:10.1037//0022-0663.82.1.22
Staker, H., Chan, E., Clayton, M., Hernandez, A., Horn, M. B., & Mackey, K. (2011). The rise of K–12 blended learning: Profiles of emerging models. Retrieved from http://www.innosightinstitute.org/innosight/wp-content/uploads/2011/01/The-Rise-of-K-12-Blended-Learning.pdf
Watson, J. (2008). Blended learning: The convergence of online and face-to-face education. North American Council for Online Learning.
Weimer, M. (2013). Learner-centered teaching: Five key changes to practice. San Francisco, CA: John Wiley & Sons.
Woolf, B., Burleson, W., Arroyo, I., Dragon, T., Cooper, D., & Picard, R. (2009). Affect-aware tutors: Recognising and responding to student affect. International Journal of Learning Technology, 4, 129–164. doi:10.1504/IJLT.2009.028804
Zimmerman, B. J., & Kitsantas, A. (1997). Developmental phases in self-regulation: Shifting from process goals to outcome goals. Journal of Educational Psychology, 89(1), 29–36. doi:10.1037//0022-0663.89.1.29
© Henrie, Bodily, Manwaring, and Graham