Oleksandra Skrypnyk1, Srećko Joksimović2, Vitomir Kovanović2, Dragan Gaševic2, and Shane Dawson1
1University of South Australia, 2University of Edinburgh, Scotland
Distributed Massive Open Online Courses (MOOCs) are based on the premise that online learning occurs through a network of interconnected learners. The teachers’ role in distributed courses extends to forming such a network by facilitating communication that connects learners and their separate personal learning environments scattered around the Internet. The study reported in this paper examined who fulfilled such an influential role in a particular distributed MOOC – a connectivist course (cMOOC) offered in 2011. Social network analysis was conducted over a socio-technical network of the Twitter-based course interactions, comprising both human course participants and hashtags; where the latter represented technological affordances for scaling course communication. The results of the week-by-week analysis of the network of interactions suggest that the teaching function becomes distributed among influential actors in the network. As the course progressed, both human and technological actors comprising the network subsumed the teaching functions, and exerted influence over the network formation. Regardless, the official course facilitators preserved a high level of influence over the flow of information in the investigated cMOOC.
Keywords: Teaching; socio-technical networks; social network analysis; MOOCs
There is much debate over the role of Massive Open Online Courses (MOOCs) in the contemporary education space (Daniel, 2014). Although perspectives differ when it comes to questions regarding the potential for MOOCs to provide an effective business model, or their perceived education quality, MOOCs are increasingly playing a greater role in the provision of adult education online. Diverse opinions about the scaling-up of the standard online practices have given rise to the discussions about the complexities of MOOC pedagogy, such as whether online peer interactions can be scaled to address learner diversity (Stewart, 2013), or the model of pedagogical design that is most suitable for this learning context (Rodrigues, 2012; Selwyn & Buffin, 2014).
Prior to the emergence of scaled online courses, numerous studies have identified that specific instructional strategies can effectively enhance learning gains, academic performance, and student satisfaction in online and distance education settings (Garrison & Cleveland-Innes, 2005; Lou, Bernard, & Abrami, 2006; Vrasidas & McIsaac, 1999). Along with course facilitation and direct instruction, instructional strategies constitute a level of teaching presence (Anderson, Rourke, Garrison, & Archer, 2001), that plays an important role in shaping of learners’ online experience. For example, the well-known model of communities of inquiry (Garrison, Anderson, & Archer, 1999) posits that teaching presence is critical for establishing and sustaining cognitive presence and for shaping and maintaining the degree of social presence among learners (Garrison, 2011). In other words, teaching presence is instrumental to the facilitation of knowledge construction through engaged social interaction in a community of learners (Garrison, Cleveland-Innes, & Fung, 2010).
Although research related to the role of teachers has gained significant attention in online education, there are few academic studies that have extensively covered the general experiences and practices of teaching at scale (Liyanagunawardena, Adams, & Williams, 2014). Despite issues of scale, some of the findings may be transferable. In scaled online courses, teachers remain highly visible, although teaching function may be fulfilled in various ways, i.e. through information delivery in a recorded lecture, authored textbook, via facilitation of a synchronous video conference, through co-participation in online discussions, or even via an automated mailing list in MOOCs (Bayne & Ross, 2014). While there are multiple approaches for the design and delivery of MOOCs, the teaching practice can be situated on a spectrum ranging from highly centralized to highly distributed (ibid.).
Centralized MOOCs, often referred to as xMOOCs, are delivered via a learning management system with an emphasis on the teacher-chosen content. The course content is typically delivered through video lectures and often accompanied by online quizzes. In such courses, while online forum discussions are widely used, they primarily function as question and answer forums. In such contexts, the discussion forum – as a medium for facilitating social learning – is tangential to the course pedagogy. In contrast, in distributed MOOCs, or cMOOCs, social knowledge construction, peer interaction, and learner-driven discussions are designed to be the centerpiece of the course design. Teachers of distributed MOOCs structure learning activities around learner-created artifacts underlining the importance of peer engagement and discussions that take place via different technologies. Learners are encouraged to use technologies of their choice, which constitute their personal learning environments. Social networking software such as Twitter and Facebook are commonly used tools for sharing, aggregating, and connecting information (Saadatmand & Kumpulainen, 2014).
This study set out to address the knowledge gap in understanding the teachers’ role within the context of cMOOCs. We examined the positions taken up by learners, teachers, and the adopted technology in a distributed scaled online course “Connectivism and Connective Knowledge 2011” (CCK11), and how they influence the flow of information within the course. Through the analysis of course participants’ social networking positions over time, the study investigated participants’ potential to influence the flow of information and community formation among learners. We focused on student interactions on Twitter social networking platform, as it was adopted by the majority of course participants and was suggested by course facilitators as the primary communication medium. In line with the socio-technical perspective (Creanor & Walker, 2010) , we constructed a course social network consisting of course participants (i.e., learners and instructors), as well as the nodes representing technological affordances of social networking platform (i.e., Twitter hashtags). To uncover the change in the network structure, a series of social network analyses (Wasserman, 1994) was performed.
The aim of the CCK11 course was to explore and examine the application of the ideas of connectivism and connective knowledge – a theoretical view on learning that is built on the premise that knowledge is activated through the process of learners connecting to and feeding information to the broader course community (Kop & Hill, 2008, p. 2). The course ran for twelve weeks, and it was of interest to practitioners and researchers working in online education and to those facilitating online community development. Participation in the course was open, however those learners who wanted to receive a certificate had to apply for university admission and officially register their enrolment with the University of Manitoba . For the analyses, we collected learner demographic data from their various online profiles and distributed course Tweets to reconstruct the evolution of the course.
The core differences between various pedagogical designs of MOOCs lies in the provisions for learner autonomy and teacher control as embedded in the course design. Prior to the establishment of MOOCs, online learning was centered on the curriculum pre-defined by the teacher, and presented through a centralized technology (e.g., learning management system), with little pre-designed need for learners to experiment and connect outside of this technical system. The original offers of MOOCs – now known as cMOOCs and referred to as distributed MOOCs in this paper – diverged from the dominant, centralized course design and were organized as distributed courses utilizing many different online platforms. The design of cMOOCs centered on connecting learners by helping them find each other across the various distributed technological tools they were using to express their views on the course themes.
The high degree of learner autonomy afforded individuals opportunity to adopt a vast array of technologies to support their learning endeavors. This focus on the adoption of distributed tools imposed modifications on the teaching activities. That is the teachers needed to help learners meet and connect to each other. In doing so, facilitators of the first distributed courses encouraged students to explore the topic, and create a unique artifact using their preferred technologies that would constitute their personal learning environment. The official course facilitators then would use special software to aggregate these distributed activities in daily newsletters to help learners locate the content and each other, and “acquire learning for themselves, rather than have learning served to them by an alternate provider or institute” (Hollands & Tirthali, 2014, p. 33).
It was also theorized that course facilitators and learners should have an equal level of influence within the community (Downes, 2010). Both facilitators and learners would create artifacts in relation to each other’s ideas, opinions, and common course themes. Furthermore, while course facilitators would review, summarize, and reflect on the events of the course in their produced artifacts, so would the learners. Facilitators regularly sent out a course newsletter that included all web-based artifacts tagged by their authors with the course hashtag. As a result, any course participant could contribute to course discussions by marking their own content with the course hashtag.
It is important to note that this pedagogical design does not imply the elimination of the teacher’s function over time. As the discussions spread based on the growing connections between the course participants, the official course facilitator needs to draw students’ attention to certain content elements (Siemens, 2010). Facilitators are required to be constantly present to amplify, curate, filter, and guide community-driven sense-making and learning (ibid.). Still, due to the distributed control embedded in the pedagogical design, any course participant could be doing exactly the same thing, as long as the other course participants follow their lead.
Facilitating the creation of the network of learners and distributed control over the information flow, as a teaching practice, reflects the very premise of connectivist principles of learning, i.e. that knowledge is dispersed across the network of learners and occurs through the interactions between participants (Downes, 2012). To analyze the learning that takes place in a connectivist MOOC, a natural question from the perspective of knowledge construction is that of a quality of the interactions that take place. From a connectivist perspective, however, the initial question is whether the formation of the network, and its structure reflects the pedagogical intention.
Social network analysis (SNA) is used to capture and analyze the mechanisms underlying structures of learner and teacher interactions (Haythornthwaite & de Laat, 2012). Surprisingly, despite the broad popularity of SNA techniques for investigating MOOCs (Gasevic, Kovanovic, Joksimovic, & Siemens, 2014), there are few cMOOC studies that have applied SNA to examine the relationships and connections that occur between course participants in such environments. For example, Kop, Fournier, & Mak (2011) visualize the networks of learner and teacher interactions to highlight the complexity of course discussions in their evaluation of the PLENK10 cMOOC . They report that in Moodle discussions the facilitator acts as an instigator of activity and is present along with active participants. The study does not provide any SNA metrics to support this observation. Similarly, Yeager, Hurley-Dasgupta, & Bliss (2013) exploit the visual power of SNA to reflect on their experience in teaching CMC11 . They measure eigenvector centrality of course participants to identify the relative influence of a node in a network, and conclude that a course facilitator and several other participants take on higher levels of activity and are central to the network. The authors describe this group as an active core that enabled its further success. This study offers a static aggregation of the network relationships as they took place by the end of the course, but does not provide insights into how the relationships between these nodes in the core were formed and evolved over time.
Certain inferences about the role of facilitator can be made from cMOOC research that does not utilize SNA. Based on the analysis of the PLENK10 cMOOC, Kop (2011) reported that the frequency of facilitators’ postings decreased significantly overtime, while the frequency of participants’ postings increased. Such indicators suggest a decrease in the activity of a course facilitator, but it is unclear whether the decline in facilitators’ activity correlates with the decreased control over the direction of the conversations in the course, and consequently, its content.
The current study sets out to exploit SNA of the development of course network overtime to gain additional insights about its active participants, as well as their influence on the network formation. From a network analytical perspective, structural positions of the participants as captured by established measures of centrality, indicate the degree of access to people and information within the network (Burt, 2000; Haythornthwaite, 2005; Homans, 1958; Wellman, 1997). This information can be used to indicate the varying degrees of control held by various individuals within flow of information in a network at different times of the course. The underlying structure for course communication indicates opportunities and limitation for access, the change of structure may also indicate a change of power (Burkhardt & Brass, 1990).
It should be noted that cMOOC facilitators and learners are not the only agents that can influence how learners find, aggregate, and connect course information and participants. Stemming from the distributed nature of its pedagogical design, social networking software itself acts as a major enabling technology for cMOOCs by providing the certain affordances that foster information seeking and community formation. In the literature, Kop (2011) reports that in their evaluations of distributed courses, participants acknowledge the role Twitter played in humanizing learning, being instrumental to the creation of presence, and providing a “voice with the possibility to be listened to and to contribute to sense-making together with other participants”. These perceptions of the role technological affordances play in distributed MOOCs point towards an interdependent inseparable relationship between the social system of learners and the technical system of features of social media. For example, Twitter offers specific features that can directly influence the flow of information and community formation (Gruzd, Wellman, & Takhteyev, 2011) within the network of participants formed around a cMOOC. In this regard, Twitter hashtags are possibly one of the best examples for aggregating and facilitating the flow of information (Kop, Fournier, & Mak, 2011; Yang, Sun, Zhang, & Mei, 2012).
To analyse the potential to facilitate the development of a network – afforded by the social networking software used by course participants – we included Twitter hashtags as nodes into our network of course interactions. This is based on the sociotechnical perspective (Sawyer & Jarrahi, 2013) which affords a strong theoretical rationale for integrating technology into the creation of the structure that effectively enables course discussions. Socio-technical interaction framework (Creanor & Walker, 2010) treats social and technological dimensions as mutually constituted. In our particular context, treating both human participants and technological affordances as both capable of having reciprocal effect prevents the deterministic predictions about how a certain piece of technology provides specific affordances for a set pedagogy. Mutual constitution makes no prior judgment towards the importance of either social or technological aspects and requires analyzing the process of interactions as reciprocal between the contextual interactions and outcomes (Barrett, Grant, & Wailes, 2006).
The aim of this study was to examine how a teaching function was fulfilled in a particular cMOOC, and i) whether official course facilitators maintain control and power over the information flow and influence content and direction of conversations; ii) whether other course participants emerge as fulfilling similar functions, and having significant impact over the flow of the course interactions; and iii) what is the role of technological affordances in fulfilling the teaching function related to shaping the interaction patterns of a distributed MOOC.
RQ1. What was the influence of course facilitators, course participants, and technological affordances on the flow of course discussions in Twitter-based interactions at different stages of a distributed MOOC?
We assumed that if social influence was distributed – as intended by the course facilitators – it would be reflected by the network structure through several emerged communities of learners, rather than being centered on course facilitators – as it would be the case in the teacher-controlled environment.
RQ2. Were there any emerging communities from Twitter-based interactions that frame course discussions? If so, who influenced their formation?
Addressing the research questions required reaching beyond the analysis of the sheer volume of user-generated content created and exchanged via social media (Kaplan & Haenlein, 2010). To make interpretations as to why certain structures underpinned the flow of information in this course, we also enquired who was referencing whom as a part of the exchange, and where these individuals were positioned in relation to other individuals and how the individual positions shifted along with the changes in the overall student network. To implement such analysis, we applied social network analysis measures to a series of course networks, representing week-to-week changes of the information flow, and complemented these with qualitative information concerning the learners.
The analyses for the presented study were conducted using the Twitter-based network of interactions. Although Twitter poses strict boundaries on the size of each post, it was the most utilised course communication tool. In their analysis of the same CKK11 course, Joksimovic et al. (2015) reported that – despite the wide use of blogs and Facebook in the course – Twitter afforded a significantly higher interactivity of conversations, and it was used by a greater number of participants. This conclusion is also supported by the post-course reports from other cMOOCs, where participants indicated that Twitter was the most widely adopted tool and tweeting being ranked as the most frequent activity for learning and interaction (Kop, 2011; Saadatmand & Kumpulainen, 2014).
For the present study, we collected distributed asynchronous Twitter posts from the CCK11 course. The course was organized over a twelve-week period from January 17th, 2011 to April 11th, 2011. Course seminars featuring guest speakers were delivered using Elluminate (later rebranded as Blackboard Collaborate), while blog posts and tweets from participants were aggregated and distributed using gRSShopper . In our data collection, we relied on daily newsletters aggregated by gRSShopper in order to obtain 2,483 tweets from more than 800 active participants. The collected data were stored in JSON format, with the information about authors’ name, date/time created, media attached (e.g., photo, video, web page), mentions, and hashtags.
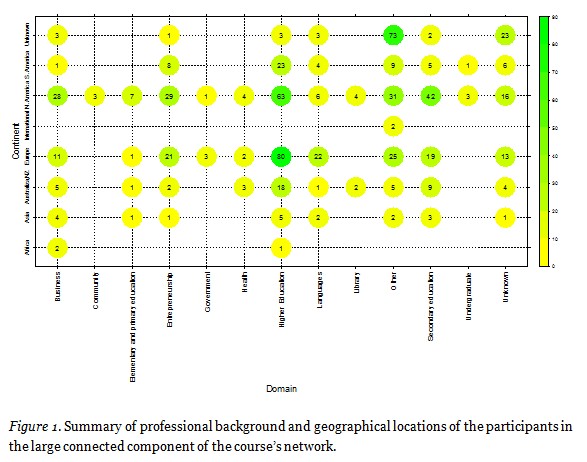
With respect to additional sources of data for this study, the CCK11 course did not include questionnaires for learners, on their personal goals, prior knowledge, nor research interests. All demographic data about Twitter participants were collected specifically for the purpose of this study and was retrieved manually from publicly available sources such as Twitter profiles, social networking sites (e.g., LinkedIn, About.me, and Blogger profiles), and through manual Web searches. The following demographic data were found relevant for an overview of course participants, and are presented in Figure 1: i) domain of work (e.g., secondary education, higher education, and health) in 2011, ii) type of work (e.g., research or practice) in 2011, iii) demographic data (e.g., location, gender, and professional background) in 2011.
As Figure 1 shows, the majority of participants were from Europe and North America and those include students from a wide variety of professions. Similarly, there were many South American, Australian, and New Zealand researchers and practitioners from the higher education. In contrast, there were few participants from Africa and Asia. Most participants had an education-related background either through formal credentialing or extensive work experience. The most frequent work domain for CCK11 participants was observed to be in higher education, with jobs ranging from practitioners in e-learning departments to academics. Another large group of participants was related to the commercial sector: implying that they were entrepreneurs, self-employed, or employed in a business or a company. The third largest group was secondary school teachers, followed by the group of English language instructors. They were grouped as “language professionals”, unless their jobs fell within the domain of English for Academic Purposes and implied higher socialization into academia. The general demographics of the course participants is similar to those reported in the research literature on xMOOCs, with high numbers of educated participants with professional backgrounds in the course’s subject (Ho et al., 2014; MOOCs@Edinburgh Group, 2013; Open UToronto, 2013).
We constructed an information exchange socio-technical network (Jamali & Abolhassani, 2006) by including all authors and adopted hashtags into the graph as nodes in the network. The network was directed, and the edge (a link between two nodes) from author @A to author @B was created in cases when author @A mentioned author @B in their tweet, whereas the edge from author @A to hashtag #C was created in cases where author @A mentioned hashtag #C in their tweet. In all cases, edge weights were calculated based on the count of links between two nodes.
The constructed network was analyzed with the common social network analysis measures (Freeman, 1979; Watts & Strogatz, 1998):
To address the first research question, we conducted social network analysis at the node-level. SNA centrality measures of closeness and betweenness, hub and authority weights, and weighted degree for each individual weekly were calculated. Plotting the changes in these metrics over-time was used to identify changes in the network structure for both learners and hashtags.
To address the second research question, we conducted analysis at the network-level. First, we applied a modularity algorithm for community detection (Newman, 2006). An initial analysis revealed more than 130 communities, with several large communities and a significant number of small communities. These small communities usually contained one to five isolated nodes, created from tweets that did not include any of widely accepted hashtags and did not mention other learners. By first identifying weakly connected smaller parts of the network, and then partitioning it, we extracted the largest connected component (LCC), which contained more than 85% of nodes from the initial network. Further analyses, using the modularity algorithm were conducted on the largest connected component. This analysis detected 19 communities.
To understand which nodes and individuals were instrumental in the emergence of these 19 communities, we retrospectively tracked the emergence of these sub-networks in earlier weeks of the course, and identified the individuals and hashtags that initiated and sustained the development of the structure for these sub-networks.
All social network measures and the modularity algorithm were computed using Pajek64 3.15, a tool for social network analysis and visualization (Batagelj & Mrvar, 2004).
Research question 1 aimed to identify the sites of influence in the cMOOC network. To address this question the node-level analyses focused on both the social and technical elements that shaped the flow of information in the course under investigation. The purpose here was to identify the nodes that occupied structural positions that enabled them to exert a stronger influence over the flow of information within the course discussions. As described below, in-degree, out-degree, closeness, betweenness, and hub and authority centralities were calculated for each course participant weekly.
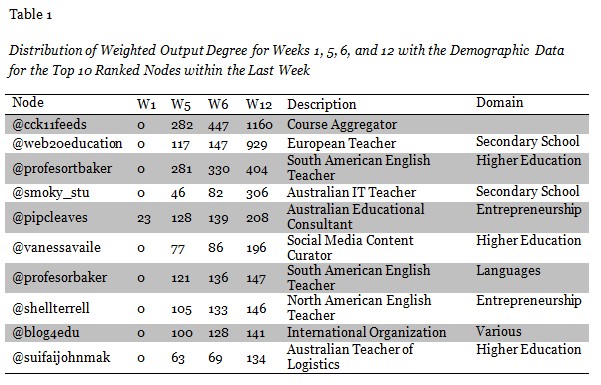
First, the most prolific nodes (Table 1) were identified by measuring weighted out-degree, associated with the number of tweets the participants made, and thus, implying certain “loudness” and “visibility” for the other course participants. Out-degree implied that a person posted out-going information, such as shared a link to their blog post, asked a question, or re-shared somebody else’s link. Since hashtags do not exercise such activities on their own, only social nodes had the weighted out-degree, and not the technical ones. The total numbers of tweets produced during the course by the most prolific social nodes are listed in Table 1.
The Twitter account associated with the highest number of tweets was @cck11feeds. It was used by course instructors to fulfill one of the facilitation roles in the cMOOC – information aggregation (Siemens, 2010). None of the remaining “most” prolific nodes were associated with any of the assigned guest speakers or original course facilitators for the cMOOC, as revealed by the analysis of the demographic data (Table 1). Interestingly, additional time-based analysis of positions of the most prolific learners showed that learners who ranked high in producing content in the second half of the course were not very active within the first weeks. This may be explained by early course experiences being “overwhelming and chaotic”, since learners were facing potentially new concepts and technologies (Siemens, 2010). The demographic data further indicated that the leaders in content production on Twitter were dispersed throughout the main locations of CCK11 participants: Australia and New Zealand, North America, Europe, and South America. The professional domains of the most prolific course Twitter participants were practice-related, and are representative of profiles found in the course.
After identification of the social nodes producing the majority of the content, we located nodes with the highest level of popularity (Table 2). Popularity was measured based on the weighted in-degree, which measures the number of times the node was referred to or mentioned. The rankings in Table 2 are based on values in the last week of the course, and reveals that the top ten most popular nodes primarily included technical (i.e., hashtags) nodes of the network. Only one social (@profesortbaker) node was found in the list of the most popular, while others were hashtags used to mark different topics within the course. We can also observe that most participants used the course hashtag #cck11 making that node most popular in the network, the same position taken by the course Twitter account by the amount of activity in the course based on weighted out-degree.
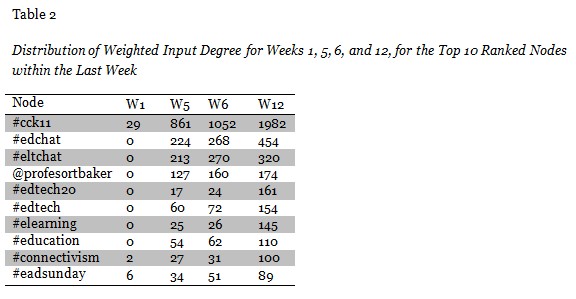
In line with prior research on hashtag affordances (Yang et al., 2012), we have observed that initially hashtags were used to mark shared information. Over time the functionality of hashtags extended, as some participants repeatedly used the same hashtags, indicating the formation of a community and a means for identifying to others an opportunity to engage. For example, hashtag #eltchat is the third most commonly referred topic theme in the last week of the course. It is used in week 2 for the first time by one person – @professortbaker – a higher education practitioner specialized in teaching English as the second language (TESOL) who was identified as a highly popular node based on his weighted in-degree value. Within the weeks to follow, #eltchat was adopted by a large number of other participants. These were English teaching professionals (over forty individuals) of all levels who participated in the course. #eltchat (English language teaching chat) identified them as a professional group and contributed to gradual promotion of this hashtag. We observed similar dynamics in the popularity growth with #edtech20 initiated in the middle of the course by highly active but not yet well-connected node @web20education; or with #elearning that was picked up in the fourth week of the course by two visible and highly prolific nodes, i.e., @daisygrisolia and @pipcleaves.
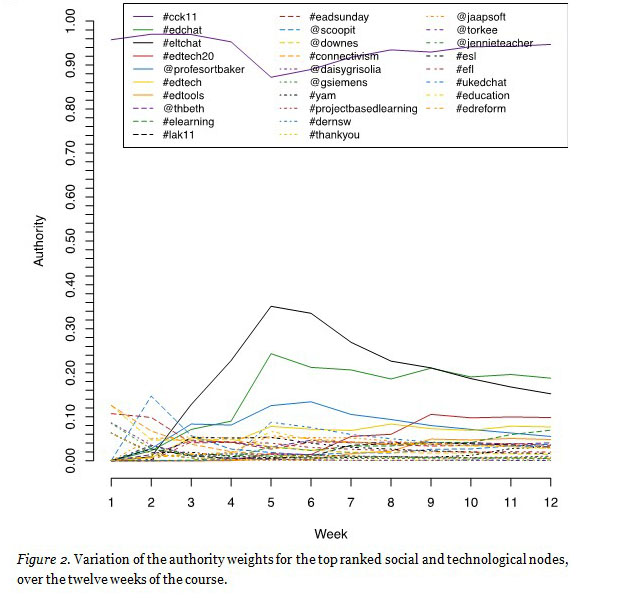
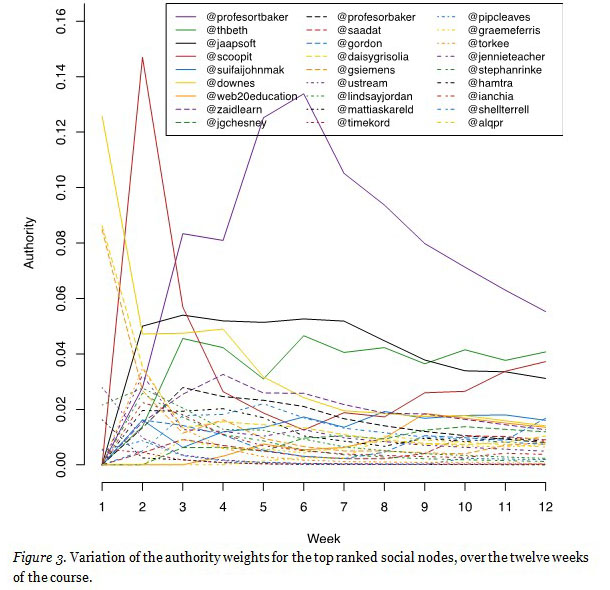
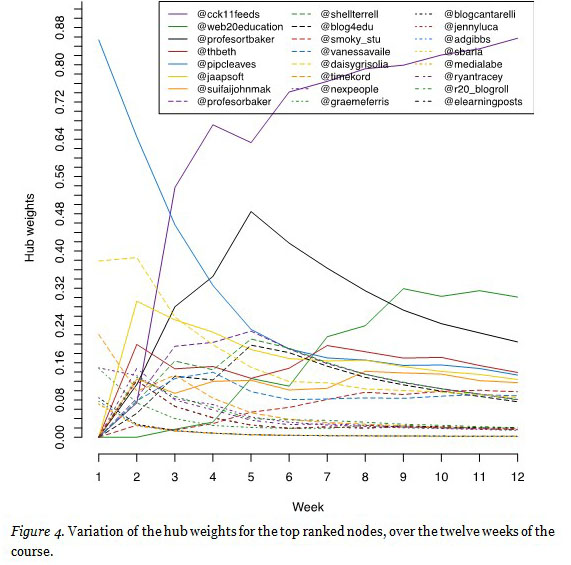
Next, hub and authority weights were calculated for each social and technical node in the network (Figure 2, Figure 3, and Figure 4). While Figure 2 shows the variation of authority weights through each week of the course for social and technical nodes, Figure 3 focuses on the social nodes only. Our analysis showed that within the social component of the network (Figure 3), the original facilitators (i.e., @gsiemens and @downes) demonstrated a high level of influence within the first week. This level of influence dramatically dropped as the course progressed. Still, both course facilitators remained among top twenty influential nodes by the end of the course, even though their hub and authority weights decreased more than a half. Several participants (e.g., @profesortbaker, @jaapsoft, and @thbeth) quickly emerged as authorities in the information flow. The hub weights distribution also shows that course participants took on one of the teaching functions – i.e., they became hubs of information flows (Figure 3). Besides the central course node (i.e., @cck11feeds) that pointed to the largest number of authorities, several “emerging” curators and aggregators became important information providers within the network, some very early on (e.g., @profesortbaker, @thbeth, @daisygrisolia, and @jaapsoft) and some a half way through the course (e.g., @web20education). Although a handful of social nodes functioned as both hubs and authorities (Figure 2, Figure 3, Figure 4), some nodes scored high only as authorities (e.g., @downes, @zaidlearn, @jgchesney, @saadat_m, @gordon_l, and @gsiemens ). Out of the top twenty authorities that have lower hub weights, the two were original course facilitators, and the others were emerging facilitators, all from the higher education sector and engaged in education research and practice.
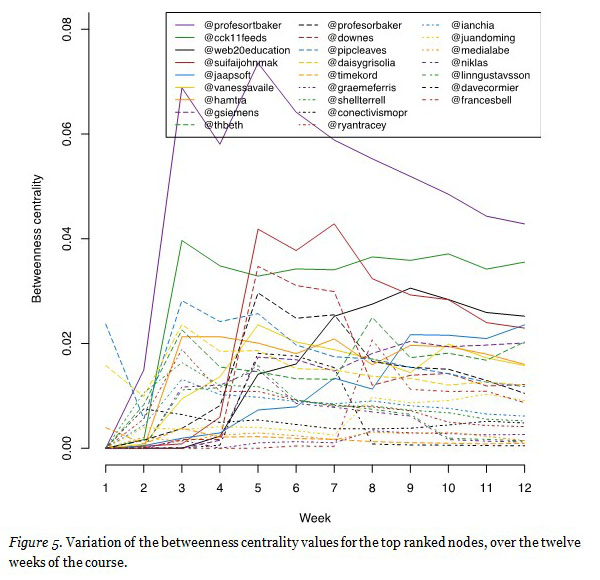
Influence over the information flow in the network is exercised through node location in relation to each other. Measurement of the betweenness centrality (Figure 5), revealed those individuals that performed a critical role in brokering information among sub-networks formed in the course (Aggarwal, 2011). Although the course Twitter node (@cck11feeds) maintained high betweenness centrality values throughout the course, betweenness centrality of emerging facilitators was higher, and thus, even more significant (e.g., @profesortbaker and @web20education). We also observed an interesting pattern for the nodes who were guest speakers in the course (e.g., @davecomier and @francesbell). They attained temporary attention by being some of the most significant brokers in the network within a few weeks after they presented on a selected topic in the course.
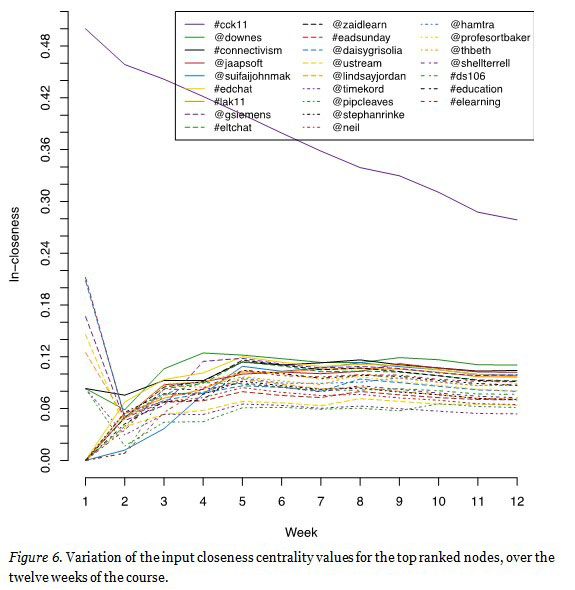
The values of the closeness centrality measures showed that both social and technical nodes – associated with the course and the original facilitators – had the highest proximity to the course participants. Given that closeness centrality measures how distant a node is from all others in the network (Aggarwal, 2011), it seems reasonable that the original course facilitators were among the nodes linked to the greatest number of participants. It also indicates their relative influence in the network, since close distances to most participants indicate that they could reach out to the majority of learners fast.
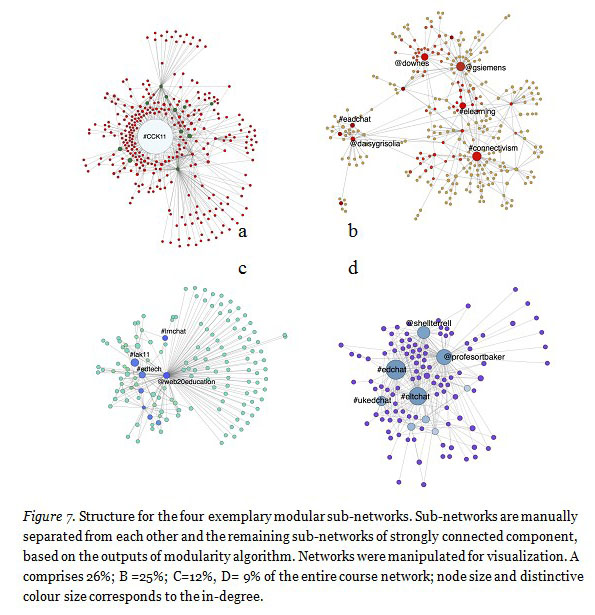
Research question 2 focused on the identification of emerging communities within the broader network structure. A modularity algorithm for detection of communities (Newman, 2006) was performed over a larger connected component resulting in the detection of 19 communities. These observed communities ranged from as large as 26% of the network to as little as 0.3% of the network. The communities were reflected by a shared interest or shared professional background that united the individuals into a community. Figure 7 shows the structures of the four largest communities. These four communities exemplify a common pattern of having one or two central nodes (sized and coloured by weighted in-degree in Figure 7) that served as the community nuclei. These nuclei occupied central positions in their sub-networks, which indicated their function of the influence over the information flow in their sub-network. From one community to the next, the larger sub-networks were centered around one or more social nodes with high ranks for authority, hubs, or degree, and who were previously identified as influential. These nodes were usually accompanied by technological nodes (i.e., hashtags that were typically created but these influential social nodes) that evolved from a content mark-up to a community identificator.
The largest sub-network revolved around #cck11 (Figure 7a), and included either some of the most active or the most popular nodes (e.g., @vanessavaile, @jaapsoft, and @suifaijohnmak). Interestingly, according to the modularity algorithm original course facilitators were not identified as a part of this sub-network. This means that they were not as closely interconnected with the members of this sub-network, as compared to their connectedness to the nodes of another sub-network. In that sense, this largest sub-network of learners has its own emergent authorities (i.e., @francesbell, @thebeth, @gordon_l, and @hamtra). The second largest sub-network was the home for both original course facilitators; in this community, @downes and @gsiemens were two magnets with many satellites around them (Figure7b). Quite a few social nodes around them were researchers well-known in the field of online education (e.g., @jimgroom, @cogdog, @mweller, @ignatia, @davecormier, @gconole, and @etiennewenger). The sub-network that included @gsiemens and @downes also hosted many higher education researchers. Through #elearning and #connectivism, higher education researchers and practitioners from this community reached out to smaller sub-communities of practitioners (Figure 7b). For example, a Brazilian sub-community was formed early in the course and led by @daisygrisolia and around a hashtag #eadchat, a chat about distance education, i.e., “educação a distancia” in Portuguese. The remaining two sub-networks given in Figure 7 (c-d) showed similar dynamics. Figures 7c and 7d depict the cases of @professortbaker with the #eltchat community and @web20education with the #edtech20 community. The network positions of @professortbaker and @web20education have been explained above.
Social network analysis combined with qualitative demographic data demonstrated that these emerging communities were interest-based, and that their development was facilitated via technical nodes (i.e., hashtags) and one or two active social nodes (i.e., course participants). These empirical results reflect the premise of the connectivist philosophy based on the diversity of learners and offered some evidence that the power and control over the information flow were distributed among the network participants who were not original course facilitators (i.e., Stephen Downes and George Siemens).
In the investigated cMOOC, teachers, course participants, and Twitter hashtags all had a role to play in the flow of course discussions. Our analysis confirms that course facilitators preserved a high level of influence over the flow of information in the course as both facilitators maintained influential positions, as shown by their high authority weights, and high betweenness and closeness centralities. These measures represent that course facilitators kept a position of prestige among other influential nodes (authority weights). They also maintained their roles as brokers between disparate parts of the learners’ network (betweenness centrality), and therefore, held a level of influence on how fast information could spread around the network (closeness centrality). It should be noted that all SNA measures describing the positions of course facilitators in the network of learners have decreased over the duration of the course.
In relation to the role of course participants in the network of learners, our analysis indicated that over the course progression, a group of nodes developed network positions comparable to those of facilitators. This group of emergent influential nodes included both human participants and hashtags. More specifically, as measures of facilitators’ centrality associated with various aspects of influence over communication in the course have decreased, we observed the increase of the same centrality measures describing the positions of some technological and social nodes. This indicates that changes in the network structure occurred (Figure 2-6). By the end of the course, it is the learners and Twitter hashtags that are mostly mentioned (high in-degree) and that produced the highest volume of content (i.e., obtained high out-degree).
Our study also shows that top ten nodes with the highest in-degree were primarily hashtags. This suggests that people were connecting around thematic markers of common interest, referring to them and making them popular. In fact, thematic analysis of the same dataset (Joksimović, Kovanović, et al., 2015) confirms that the learners were more focused on the topics of interest, rather than those suggested by course facilitators, and that those topics emerged quickly in the course, and were maintained by the groups of people that adopted them. Hashtags also achieved high SNA metrics on closeness centrality, indicating that some themes were adopted by an overwhelming majority of learners. Finally, a few hashtags with high authority weights were the thematic markers used by many influential human nodes.
The study findings suggest that both human and technological actors subsumed the teaching functions, and exerted influence over the network. It appears that with time, several interest-based sub-communities emerged. By visualizing the structure of these emerging sub-networks from week-to-week, we observed that some of the influential nodes were instrumental to the formation of these sub-networks. Such course participants as @professorbaker or @web20education exercised sharing activities related to the teaching functions of the course such as curating, aggregating and being persistently present. The nature of their contribution was diverse – from sharing the information about weekly activities and promoting blogs, to giving their opinion on the topics of interest or challenging new opinions based on topics being discussed. Other learners picked up some of the thematic markers (hashtags) used by these highly prolific participants, and interest-based sub-networks were formed around such hashtags.
Not all individuals maintained equally high metrics on all the SNA measures. That implies the different participants may play slightly different roles in the course: i) hyperactive aggregators that evolve into curators for specific topics and ii) less visible yet influential authorities. The demographic characteristics for these hyperactive users are diverse. Complementary research on ‘super-posters’ in xMOOCs suggests that online hyperactivity may be a natural personality trait (Huang, Dasgupta, Ghosh, Manning, & Sanders, 2014). Future research should investigate the effects of individual differences – such as the big five personality traits (Digman, 1990), epistemic beliefs, personal goals set in a course, metacognition, digital literacy, and familiarity with a particular medium/technology on behaviour within a network. Findings of such research could be used to construct informed instructional interventions that may help individual learners and the network as a whole become more effective in knowledge construction and information sharing. For stronger generalizations about the role of hyperactive network-oriented individuals, it is necessary to conduct further inquiries into distributed MOOCs.
Current study offers an initial peak into how networks of learners are developed in scaled online courses. First and foremost, it is limited to the specific disciplinary nature of the course, and further studies are required to test for generalizability of the findings across a diversity of disciplines adopting a cMOOC design. Secondly, study results only partially represent the full suite of social and technical interactions that were formed during the course. For our analysis we selected only one medium (Twitter) due to its heavy adoption and usage among course participants and therefore, interactions within blogs, synchronous activities, a Facebook group, and other social media were excluded. Finally, CCK11 mirrored the content of its preceding course CCK08. This duplication of the course offering needs to be investigated in future research, as it is possible that a subset of the participants had pre-existing relationships and established expectations related to the course offering.
The findings reported in this paper offer a number of research and practical implications. Firstly, information sharing within cMOOCs must account for both the role of technological agents as well as social (i.e., human) agents. Modeling the network formed around a cMOOC from the socio-technical perspective, we were able to observe the importance of technology, and its influence on shaping discussions within the cMOOC under investigation. The fact that hashtags were the most popular nodes (based on weighted out-degree measures) and that the role they played in the community development and hub/authority promotion indicates that they should be observed in the analysis as equally important as the social nodes comprising the overall network structure. Technological nodes showed a significant influence on the choices made and content of interactions among the social nodes. As the technological nodes did not fulfill any of the community-related functions on their own, the community formation was established through the choices and actions of the social nodes. Still, their choices were influenced by the affordances of the technology used for information sharing and social interaction (e.g., search by hashtags).
The application of social network analysis and the inclusion of multiple technologies pose numerous methodological and practical challenges. For example, should a network be constructed based on the interaction of all these different sources, and if so, should the links from different media be weighted differently? Practically, the integration of users identified from different social media can be a challenge and can pose a threat to the validity of such an approach. Alternatively, is it more suitable to have separate social networks for each medium of interaction and compare patterns of networks among such networks? It is likely that in some cases both approaches (i.e., single joined and multiple separate networks) will be used depending on the types of questions asked in the studies and the particular narrative to be explored. In that process, understanding of the previous learners’ experiences with learning in similar settings and technologies used can be essential. For example, in a course that attracts many educational technologists, the use of social media such as Twitter can play the critical role; in other cases (e.g., computing), some other media can be preferred by the course participants (e.g., discussion boards). Theoretically, socio-technical networks are poised to change teaching dynamics from the wide-spread model of command and control of the learning process to a more embedded networked facilitation (Siemens, 2010). However, this transformation does not simply arise as a result of course design. Transformation will only happen when certain pedagogical choices are embraced and promoted. In this regard, a combination of thematic tagging (through hashtags), searching by tags, and aggregation emerges as a pedagogical technique that allows for more democratic but manageable discussions. This approach however is closely intertwined with the attributes of the particular technologies used in courses. In our study, the role of hashtags in the community creation was apparent. The importance of hashtags shows how a simple mechanism of thematic tagging allows for creating a network within which learners can easily access information and even enable course learners to become the most influential nodes in the information flow (i.e., emerge as facilitators for specific communities).
The significance of hashtags for influencing information flows and community formation can be an important lesson for those who strive to build software that makes centralized discussion forums more learner-centered. Centralized forums could integrate simple features to cater for tagged discussions, and facilitators can adopt support technologies for collecting emerging themes in summaries (similar to gRSShopper). The aggregation of themes provides a social component that may assist learners in forming communities around topics of interest. Such technologies can offer personalized information for each learner by matching information aggregated with the learners’ needs and interests. Moreover, discussion forums can also become more fluid by allowing for an easy integration of different social media into discussion forums as done in Elgg , an open social networking software. For example, Thoms & Eryilmaz (2014) compared the effects of asynchronous online discussions among different groups of students within the same course where the instructional design and content was identical and the only difference was that some groups used Elgg and other groups used a conventional learning management system for asynchronous online discussions. In spite of the instructional equivalency, the groups that used Elgg exhibited a significantly higher academic achievement, student retention learning satisfaction, and the amount of social interactions over the groups that used the conventional learning management. Similar studies are necessary in the context of MOOC research to investigate the effects of the use of different technologies on the roles of original and emerging facilitators in the control of information flow and community formation.
The authors would like to state that there was no conflict of interest involved in the reported study. Datasets were established from information collected in the public domain. Such data collection is exempt from institutional clearance since the information is publicly accessible and there is no reasonable expectation of privacy (Canadian Institutes of Health Research, Natural Sciences and Engineering Research Council of Canada, & Social Sciences and Humanities Research Council of Canada, 2010, p. 17). The research was guided by the Recommendations from the Association of Internet Research Working committee (Ess & the AoIR ethics working committee, 2002; Makrham & Buchanan, 2012). All analysed datasets are stored in a secure password-protected personal repository, and the second author should be contacted for further inquiries regarding access to the data.
Aggarwal, C. C. (2011). An introduction to social network data analytics. Springer.
Anderson, T., Rourke, L., Garrison, D. R., & Archer, W. (2001). Assessing teaching presence in a computer conferencing context. Journal of Asynchronous Learning Networks, 5, 1–17.
Barrett, M., Grant, D., & Wailes, N. (2006). ICT and organizational change introduction to the special issue. The Journal of Applied Behavioral Science, 42(1), 6–22.
Batagelj, V., & Mrvar, A. (2004). Pajek—analysis and visualization of large networks. Springer.
Bayne, S., & Ross, J. (2014). The pedagogy of the Massive Open Online Course (MOOC): The UK view (Curriculum (including learning, teaching and assessment). Pedagogic approaches No. HEER000427) (pp. 1–76). Retrieved from http://www.heacademy.ac.uk/assets/documents/elt/HEA_Edinburgh_MOOC_WEB_030314_1136.pdf
Burkhardt, M. E., & Brass, D. J. (1990). Changing patterns or of change: The effects of a change in technology on social network structure and power. Administrative Science Quarterly, 35(1), 104–127.
Burt, R. S. (2000). The network structure of social capital. Research in Organizational Behaviour, 22, 345–423.
Canadian Institutes of Health Research, Natural Sciences and Engineering Research Council of Canada, & Social Sciences and Humanities Research Council of Canada. (2010, December). Tri-Council Policy Statement: Ethical conduct for research involving humans.
Creanor, L., & Walker, S. (2010). Interpreting complexity: A case for the sociotechnical interaction framework as an analytical lens for learning technology research.
Daniel, J. (2014). Foreword to the Special Section on Massive Open Online Courses MOOCs–Evolution or Revolution? MERLOT Journal of Online Learning and Teaching, 10(1), 4.
Digman, J. M. (1990). Personality structure: Emergence of the five-factor model. Annual Review of Psychology, 41(1), 417–440.
Downes, S. (2010, December 14). Fairness and equity in education. Retrieved from http://www.huffingtonpost.com/stephen-downes/democratizing-education_b_794925.html
Ess, C., & the AoIR ethics working committee. (2002). Ethical decision-making and Internet research: Recommendations from the AoIR ethics working committee (p. 33).
Freeman, L. C. (1979). Centrality in social networks conceptual clarification. Social Networks, 1(3), 215–239.
Garrison, D., Anderson, T., & Archer, W. (1999). Critical inquiry in a text-based environment: computer conferencing in higher education. The Internet and Higher Education, 2(2-3), 87–105.
Garrison, D. R. (2011). E-learning in the 21st century: A framework for research and practice. Taylor & Francis.
Garrison, D. R., & Cleveland-Innes, M. (2005). Facilitating cognitive presence in online learning: Interaction is not enough. American Journal of Distance Education, 19(3), 133–148. http://doi.org/10.1207/s15389286ajde1903_2
Garrison, D. R., Cleveland-Innes, M., & Fung, T. S. (2010). Exploring causal relationships among teaching, cognitive and social presence: Student perceptions of the community of inquiry framework. The Internet and Higher Education, 13(1–2), 31–36. http://doi.org/10.1016/j.iheduc.2009.10.002
Gasevic, D., Kovanovic, V., Joksimovic, S., & Siemens, G. (2014). Where is research on massive open online courses headed? A data analysis of the MOOC Research Initiative. The International Review of Research in Open and Distributed Learning, 15(5). Retrieved from http://www.irrodl.org/index.php/irrodl/article/view/1954
Gruzd, A., Wellman, B., & Takhteyev, Y. (2011). Imagining Twitter as an imagined community. American Behavioral Scientist, 55(10), 1294–1318. http://doi.org/10.1177/0002764211409378
Haythornthwaite, C. (2005). Social network methods and measures for examining e-learning. Social Networks, 2005, 1–22.
Haythornthwaite, C., & de Laat, M. (2012). Social network informed design for learning with educational technology. In A. D. Olofsson, J. O. Lindberg, K. Klinger, & C. Shearer (Eds.), Informed design of educational technologies in higher education : Enhanced learning and teaching (pp. 352–374). IGI Global.
Ho, A. D., Reich, B. J. F., Nesterko, S. O., Seaton, D. T., Mullaney, T. P., Waldo, J. H., & Chuang, I. (2014). HarvardX and MITx: The First year of open online courses, fall 2012-summer 2013.
Hollands, F. M., & Tirthali, D. (2014). MOOCs: Expectations and reality: Full report, 1–211.
Homans, G. (1958). Social behavior as exchange. American Journal of Sociology, 63(6), 597–606.
Huang, J., Dasgupta, A., Ghosh, A., Manning, J., & Sanders, M. (2014). Superposter behavior in MOOC forums. Proceedings of the First ACM Conference on Learning @ Scale Conference - L@S ’14, 117–126. http://doi.org/10.1145/2556325.2566249
Jamali, M., & Abolhassani, H. (2006). Different aspects of social network analysis (pp. 66–72). IEEE/WIC/ACM International Conference.
Joksimović, S., Dowell, N., Skrypnyk, O., Kovanović, V., Gašević, D., Dawson, S., & Graesser, A. C. (2015). How do you connect?: Analysis of social capital accumulation in connectivist MOOCs. In Proceedings of the Fifth International Conference on Learning Analytics And Knowledge (pp. 64–68). ACM. Retrieved from http://dl.acm.org/citation.cfm?id=2723604
Joksimović, S., Kovanović, V., Jovanović, J., Zouaq, A., Gašević, D., & Hatala, M. (2015). What do cMOOC participants talk about in social media?: A topic analysis of discourse in a cMOOC. In Proceedings of the Fifth International Conference on Learning Analytics And Knowledge (pp. 156–165). ACM. Retrieved from http://dl.acm.org/citation.cfm?id=2723609
Kaplan, A. M., & Haenlein, M. (2010). Users of the world, unite! The challenges and opportunities of Social Media. Business Horizons, 53(1), 59 – 68. http://doi.org/http://dx.doi.org/10.1016/j.bushor.2009.09.003
Kop, R. (2011). The challenges to connectivist learning on open online networks: Learning experiences during a massive open online course. The International Review of Research in Open and Distance Learning, 12(3), 19–38.
Kop, R., Fournier, H., & Mak, J. S. F. (2011). A pedagogy of abundance or a pedagogy to support human beings? Participant support on massive open online courses. The International Review of Research in Open and Distance Learning, 12(7), 74–93.
Kop, R., Fournier, H., & others. (2011). New dimensions to self-directed learning in an open networked learning environment. International Journal of Self-Directed Learning, 7(2), 2–20.
Kop, R., & Hill, A. (2008). Connectivism : Learning theory of the future or vestige of the past ? International Review of Research in Open and Distance Learning, 9(3).
Liyanagunawardena, T. R., Adams, A. A., & Williams, S. A. (2014). MOOCs: A systematic study of the published literature 2008-2012. Distance Education in China, 3, 5–16.
Lou, Y., Bernard, R., & Abrami, P. (2006). Media and pedagogy in undergraduate distance education: A theory-based meta-analysis of empirical literature. Educational Technology Research and Development, 54(2), 141–176. http://doi.org/10.1007/s11423-006-8252-x
Makrham, A., & Buchanan, E. (2012). Ethical decision-making and Internet Research: Recommendations from the AOIR ethics committee (p. 19). Association of Internet Researchers.
MOOCs@Edinburgh Group. (2013). MOOCs @ Edinburgh 2013: Report #1. The University of Edinburgh. Retrieved from http://hdl.handle.net/1842/6683
Newman, M. E. (2006). Modularity and community structure in networks. Proceedings of the National Academy of Sciences, 103(23), 8577–8582.
Open UToronto. (2013). Demographic report on University of Toronto Coursera MOOCs. Retrieved from http://www.ocw.utoronto.ca/demographic-reports/
Rodrigues, O. (2012). MOOCs and the AI-Stanford like courses: Two successful and distinct course format for massive open online courses. European Journal of Open, Distance and E-Learning, 1–13.
Saadatmand, M., & Kumpulainen, K. (2014). Participants’ perceptions of learning and networking in connectivist MOOCs. MERLOT Journal of Online Learning and Teaching, 10(1), 16–30.
Sawyer, S., & Jarrahi, M. H. (2013). Sociotechnical approaches to the study of Information Systems. In Computing handbook, Third Edition.
Selwyn, N., & Buffin, S. (2014). The discursive construction of MOOCs as educational opportunity and educational threat (pp. 1–4).
Siemens, G. (2010).Teaching in Social and Technological Networks, Connectivism.
Stewart, B. (2013). Massiveness + openness = New literacies of participation? MERLOT Journal of Online Learning and Teaching, 9(2).
Thoms, B., & Eryilmaz, E. (2014). How media choice affects learner interactions in distance learning classes. Computers & Education, 75(0), 112 – 126. http://doi.org/http://dx.doi.org/10.1016/j.compedu.2014.02.002
Vrasidas, C., & McIsaac, M. S. (1999). Factors Influencing interaction in an online course. American Journal of Distance Education, 13(3), 22–36.
Wasserman, S. (1994). Social network analysis: Methods and applications. Cambridge University Press.
Watts, D. J., & Strogatz, S. H. (1998). Collective dynamics of “small-world”networks. Nature, 393(6684), 440–442.
Wellman, B. (1997). Structural analysis: From method and metaphor to theory and substance. Contemporary Studies in Sociology. Retrieved from http://homepage.ntu.edu.tw/ khsu/network/reading/wellman2.pdf
Yang, L., Sun, T., Zhang, M., & Mei, Q. (2012). We know what@ you# tag: Does the dual role affect hashtag adoption? In Proceedings of the 21st international conference on World Wide Web (pp. 261–270). ACM.
Yeager, C., Hurley-Dasgupta, B., & Bliss, C. A. (2013). cMOOCs and global learning: An authentic alternative. Journal of Asynchronous Learning Networks, 17(2), 133–147.
© Skrypnyk, Joksimović, Kovanović, Gaševic, and Dawson