
Volume 17, Number 4
María-Jesús Martínez-Argüelles and Josep-Maria Batalla-Busquets
Universitat Oberta de Catalunya
This paper examines the influence that student perceived quality of service (PSQ) has on continuance intention and willingness to recommend a course in a fully online university. A holistic view of the service provided by the university is taken. It is not only the effect of the teaching which is examined, but also that of the administrative services, the additional services, and the virtual learning environment (user interface). Through a survey completed by 1,870 students and the subsequent analysis using structural equations, we found that each of these services has a significant impact on the students' PSQ, their level of satisfaction, and, as a result, their loyalty and willingness to recommend the university. The study found that the perceived quality of the administrative services can have a comparatively higher impact on student satisfaction than the other services. PSQ is shown to have also a direct impact on student loyalty and recommendations. Moreover, as a whole, non-teaching services have a greater impact on loyalty and willingness to recommend than teaching service.
The peculiarities of the process of providing educational services in a virtual environment (such as the absence of face-to-face interaction between student and teacher and the lack of conventional tangible elements which act as benchmarks for quality of service) are well-known. The relationship established in the literature between the constructs of service quality, satisfaction, loyalty, and willingness to recommend the service in an offline environment can also be seen in this context.
The interconnection of factors proves to be more complex and interrelated than has been accounted for as yet in the scholarly literature. The findings of the survey are relevant to system concerns related to quality management and sustainability, both of which are increasingly important in today’s competitive educational postsecondary environment.
Keywords: loyalty, service quality, satisfaction, e-learning
The quality of service provided in higher education received increasing attention over the first decades of the 21st century. Nevertheless, there are few studies which analyse the correlation between students' perceived quality of service and their willingness continue studying (Gallifa & Batallé, 2010; Parves & Ho, 2013; Voss, Gruber, & Szmigin, 2007), and their recommendation of the university to others (Alves & Raposo, 2010; Martensen & Dahlgaard 1999; Webb & Jagun, 1997). These kinds of studies are even scarcer when the education services are provided online (Chow & Shi, 2014; Dehghan, Dugger, Dobrzykowski, & Balazs, 2014; Lee, 2010; Semeijn, van Riel, van Birgelen, & Streukens, 2005; Sørebø, Halvari, Flaata, & Kristiansen, 2009), while the presence of e-learning is increasing significantly in all countries.
However, it is important to study this correlation in a university context which is increasingly competitive. For educational institutions to be profitable and thrive, student loyalty is essential. There is strong theoretical and empirical evidence which shows that loyal users not only make more frequent and higher value purchases, but are also more resistant to offers from competitors and more active in promoting a positive image of the institution (Alves & Raposo, 2010; Bolton, 1998; Dick & Basu, 1994; Rust et al., 1995). This last point is of particular importance in a virtual learning environment due to the speed with which information travels in this context (Anderson & Mittal, 2000; Iacobucci, Grayson & Omstrom, 1994; Lee, 2010; Reichheld, 1994; Reichheld & Schefter, 2000). In fact, regarding online services, user loyalty is a key aspect. Attracting new learners via the internet is an expensive business (Reichheld & Schefter, 2000); furthermore, competitors are “only a click away,” which makes it hard to gain student loyalty. In addition, the fact that these service exchanges happen online and do not involve direct physical interaction makes student retention more complicated, as the personal contact involved in offline transactions offers greater potential in terms of loyalty (Batalla-Busquets & Martínez-Argüelles, 2014; Semeijn et al., 2005).
The majority of the studies completed on student continuance intention focus on issues related, strictu sensu, to academic performance as a predictor of dropout rates (Ambroggio, 2000; Pal, 2012). Nevertheless, these same studies show that academic performance only accounts for, approximately, half of the variance of dropout rates. As a result, there are a growing number of studies which show that there are other factors which affect student commitment to a particular academic institution, such as social integration (Bers & Smith, 1991; Deil-Amem, 2011), pre-matriculation attitudes (Baker, McNeil, & Siryk, 1985; Rivas, Sauer, Glynn, & Miller, 2007), the existence of goal and institutional commitment (Tinto, 1987), or satisfaction with the teaching (DeShields Jr., Kara, & Kainak, 2005), among others. On the whole, the most recent studies (Chow & Shi, 2014; Lee, 2010; Voss et al., 2007) show that the perceived quality of teaching is the most decisive factor with regards to students' intention to enrol, due to the influence this has on student satisfaction levels, and as a result, their willingness to continue their academic relationship with a specific university (Lovelock & Wirtz, 2004). However, instructional quality does not account for the majority of the influence; other service factors do.
Nevertheless, in so far as the learning process in a virtual environment constitutes a complex activity made up of different complementary processes – tutoring, administrative procedures, support services, available technology – which, additionally, is extended over a relatively long period of time, the perceived quality of service construct must be analysed in connection to all of these (Cox & Dale, 2001; Meuter, Ostrom, Roundtree, & Bitner, 2000). In fact it is said, particularly in online environments, that consumers tend to assess their experience holistically (van Riel, Liljander, & Jurriëns, 2001) rather than looking at each the subprocesses associated with providing the service in question.
To further the studies done in recent years by various authors in the area of offline higher education (Agrawal & Tan, 2014; Aldridge & Rowley, 1998; Chong & Ahmed, 2015; Hill, Lomas, & MacGregor, 2003; Joseph & Joseph, 1997; Joseph et al., 2005; Kwan & Ng, 1999; LeBlanc & Nguyen, 1997; Li & Kaye, 1998; Marzo-Navarro, Pedraja, & Rivera-Torres, 2005; Oldfield & Baron, 2000; O’Neill & Palmer, 2004; Owlia & Aspinwall, 1998; Russell, 2005), this paper will consider the impact of university students' overall experience with regard to the instructional and non-instructional services offered in a virtual training environment. These services are specified below (Table 1).
Table 1
Dimensions of Service
| Denomination | Description | |
| Instructional service | Teaching service (Core service) | Set of service aspects strictly related to teaching. For instance, aspects as the knowledge, experience and teaching skills of teachers, the feedback that teachers give to students to the different activities undertaken as well as the speed and effectiveness in resolving questions posed by students. |
| Non-instructional services | Administrative services | They are ancillary services, but essential for obtaining the core service (Grönroos, 1990). In this case, these services refer mainly to administrative processes, such as registration or obtaining certificates. Among them, students appreciate the responsiveness (Parasuraman, Zeithaml & Maholtra, 2005; Zeithaml, Parasuraman, & Maholtra, 2002) when resolving administrative problems or raise complaints or claims. |
| Additional or complementary services | Services that are not required for the existence of the main service, teaching, but which contribute to differentiate the training offered by an institution. For example: the job bank, practices in companies or institutions, library, conferences, seminars and workshops (which may be in person). | |
| User interface | This dimension is derived from the fact that teaching and other relationships with students develop in a virtual or online environment. These services refer to what some authors call reliability or availability of the system (Parasuraman et al., 2005; Zeithaml et al., 2002). They relate to the technical operation of the website, for example, with the speed of navigation and the loading and unloading of pages and files, with the ability to connect to the campus quickly and at all times, and the strength, simplicity and intuitiveness navigation around the campus. |
In particular, this study aims to analyse the existing relationship between the multiple dimensions of the service in an e-learning context, the perceived quality of these service, student satisfaction, willingness to continue studying, and to recommend learning at university in an e-learning environment.
The objective of this article is to analyze to what extent do the various dimensions of the service, the level of perceived quality of service and/or, where appropriate, the level of satisfaction, create a noticeable and significant impact on loyalty and/or willingness to recommend the service? How do these constructs interact in the virtual learning environment? Establishing the properties and strength of these conceptual relationships in the context of online higher education is essential in order to evaluate the strategic and operational implications of the perceived quality-of-service construct.
In Martínez-Argüelles, Blanco, & Castán (2014) four dimensions were identified as relevant to the students' perceived quality of service: (1) The core service -teaching, (2) the administrative services, (3) the additional services, and (4) the user interface. This paper aims primarily to test the hypothesis of the positive and significant influence of each and every one of these dimensions both on the perceived quality of service and on the students' level of satisfaction. Therefore, the four dimensions are included in the model as the basis for both quality and satisfaction. The underlying assumption is that while both constructs -quality and satisfaction– are considered simultaneously, all factors continue to exert significant influence on each other. This situation is reflected by the sub-hypotheses, first H1a, H1b, H1c, and H1d and then, H2a, H2b, H2c, and H2d.
Hypothesis H1: The dimensions of the service have a positive and significant impact on the perceived quality of service.
The core service (H1a), the administrative services (H1b), the additional services (H1c) and the user interface (H1d) have a positive and significant effect on the perceived quality of service.
Hypothesis H2: The dimensions of the service have a positive and significant impact on student satisfaction.
The core service (H2a), the administrative services (H2b), the additional services (H2c) and the user interface (H2d) have a positive and significant effect on student satisfaction.
Several studies (Dabholkar & Thorpe, 1994; Oliver, 1980; Rust & Williams, 1994) have found that there is an indirect causal relationship between the perceived quality of service and purchase intention, as this appears to be mediated by other variables such as satisfaction.
With regards to satisfaction in particular, it should be noted that while there is relative consensus that it is a conceptually different construct to perceived quality of service, as defined in academic literature in this field (Bitner, 1990; Bolton & Drew, 1991; Oliver, 1993; Spreng & Mackoy, 1996), the relationship between the two constructs has been the subject of much debate seeking to establish whether the perceived quality of service is an antecedent of consumer satisfaction or vice versa (Teas, 1993).
The typical response is based on the idea that the level of consumer satisfaction from each individual experience of the service generates, over time, an attitude or overall evaluation of the perceived quality of service (Bitner, 1990; Parasuraman, Zeithalm, & Berry, 1988; Oliver, 1980, 1981). From this point of view, in the students’ mind, satisfaction is a precursor to perceived quality of service, understanding this as student’s relatively enduring affective orientation for a service, that is to say, a general evaluation of the quality of the product or service; while satisfaction would be similar to this attitude, but in the short-term as it would be the result of the assessment of a particular consumer experience (Bigné, Sánchez, & Sánchez, 2003). In recent years, however, the opposite point of view has taken hold. Oliver (1993) was first to suggest that quality of service could be antecedent to consumer satisfaction, regardless of whether this construct was evaluated with reference to a particular experience or over a period of time. Several empirical studies have since confirmed this argument (Anderson & Sullivan, 1993; Dabholkar, 2000; Spreng & Mackoy, 1996), consolidating the idea that perceived quality of service precedes consumer satisfaction. In line with these recent studies, this paper considers quality as an antecedent to satisfaction as established in model (H3).
Hypothesis H3: The perceived quality of service has a positive and significant influence on students' level of satisfaction.
As stated before, the final objective of this paper is to analyse how students' perceived quality of service impacts on their willingness to continue studying and to recommend their course. To this end, the hypothesis that there is a direct relationship (H4) between satisfaction and intention to continue studying (loyalty) is established. Which, at the same time, implies an indirect or mediated relationship between quality and loyalty (by way of satisfaction).
Finally, this paper aims to verify that the willingness to recommend the service is influenced in particular by consumer loyalty (H6), but also be the student's own level of satisfaction (H5).
Hypothesis H4 : Students' level of satisfaction has a positive impact on their loyalty (willingness to continue studying).
Hypothesis H5 : Students' level of satisfaction has a positive influence on their willingness to recommend their course.
Hypothesis H6 : Student loyalty has a positive and significant impact on their willingness to recommend their course.
A model showing the relationships between the variables in all of the aforementioned hypotheses can be seen in Figure 1 (initial model, MI).
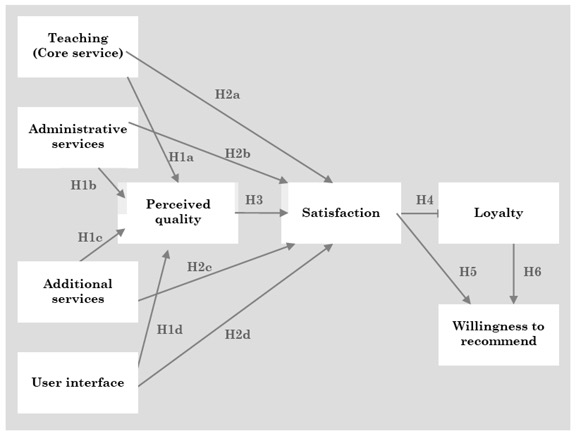
Figure 1. Structural model showing the relationships between the key variables.
This section aims to empirically elucidate the properties and strength of the links between the variables in Figure 1. To test these hypotheses students from the Universitat Oberta de Catalunya (UOC) were surveyed. This university runs all its undergraduate and postgraduate courses completely online. An online survey was sent by e-mail to the personal account of students enrolled in undergraduate degree courses at the UOC (25,223). Of these, 1,870 valid responses were received, with a sample error of 2.18%. Furthermore, the students whose opinions were finally considered in the study were found to be representative of the student population, and no significant bias occurred from only including those students who had voluntarily completed the questionnaire, contrasting the absence of any significant differences between the first and last responses (Amstrong & Overton, 1977).
The design process of the questionnaire used the critical incident technique to perform a preliminary qualitative analysis (Chell, 1998), in order to identify relevant and significant aspects of the service for online students (Phelan, 2012). Examining the attributes generated in this qualitative analysis approach and using the e-SERVQUAL structure as a scale (Parasuraman et al., 2005; Zeithaml et al., 2002), a questionnaire consisting of 33 items was designed. A pre-test was carried out and after the corresponding refinement process this was reduced to 30 items, which made up the main part of the questionnaire. Through a factorial analysis (Martínez-Argüelles et al., 2014), 24 of these items were summarized in four relevant dimensions: (1) The core service-teaching, (2) the administrative services, (3) the additional or complementary services, and (4) the user interface.
Furthermore, in the survey questions were added regarding the global perception of quality of service, satisfaction with the same, willingness to continue studying, and to recommend to third parties. Finally, a group of questions were included in order to classify the respondents (age, gender, and so on).
With the resulting data from these students, the hypothesis in the initial structural model (MI) was tested. After analysing the variables for normality, two variables are observed to display substantial non-normality (student willingness to continue studying and to recommend their course) and, in addition, the assumption of multivariate normality is not met. As a result, an estimation is applied using the Asymptotically Distribution-Free Function (ADF), as this does not require the variables to follow a multivariate normal distribution and yields efficient and consistent estimates. ADF application requires large sample sizes; the more complex the model the larger the sample. Considering the number of observed variables in the model we are estimating, the sample size is appropriate.
Then, using the procedure established by Byrne (2001), the causal validity established in the initial model (IM) is tested. First the key results relating to the different adjustment measures of the global model are analysed (Table 2). With regard to the absolute fit measures, the model is seen to be, in general, a good fit: χ2 does not perform well (probably due to large sample size), but the GFI takes on a value above 0.9 (0.96) and the RMSEA is within the acceptable margins – with a value below 0.08. The incremental adjustment measures show a remarkable AGFI performance reaching a value of 0.92, although, the other measures (TLI, NFI, and CFI) do not show such a good fit, as they do not reach the minimum of 0.9 usually recommended. The parsimony-adjusted measures perform better than the reference model. With regard to the measurement-model fit, the established causal relationships are found to be statistically significant. Accordingly, all established hypotheses related to the initial model have been verified. Thus, each and every one of the dimensions has a significant effect on the perceived quality of service construct and on that of satisfaction. The perceived quality has a significant effect on student satisfaction and this, in turn, has a considerable effect on the willingness to continue studying and to recommend the course to third parties.
Next, given the objectives of the analysis, the modification indices are studied, focusing exclusively on the causal relationships of the model (Byrne, 2001, p. 153). Examination of the modification indices highlights five relationships, and their addition to the model leads to a lower chi-square value. The modifications should be added one by one (Byrne, 2001; p. 157), thus the focus is on the highest index. This refers to the addition of a relationship or the direct influence of perceived quality of service on student loyalty. This link not only has statistical significance, but may also have theoretical significance, with the result that this causal relationship is also added to the initial model, creating what is referred to as Model II.
Table 2
Comparative Structural Models
| Measures | Model I | Model II | Model III | |
| Initial Model | Modified Initial Model quality loyalty | Modified Model II quality loyalty | ||
| Absolute fit | χ2 (g.l.) (p) | 128.632 (16) (0.000) | 60.121 (15) (0.000) | 21.139 (14) (0.098) |
| NCP | 112.632 | 45.121 | 7.139 | |
| GFI | 0.964 | 0.983 | 0.994 | |
| RMR | 0.032 | 0.020 | 0.016 | |
| RMSEA | 0.069 | 0.045 | 0.019 | |
| ECVI | 0.115 | 0.070 | 0.044 | |
| Incremental fit | AGFI | 0.920 | 0.960 | 0.985 |
| TLI | 0.802 | 0.916 | 0.986 | |
| NFI | 0.875 | 0.941 | 0.979 | |
| CFI | 0.887 | 0.955 | 0.993P | |
| Parsimonious fit | PNFI | 0.500 | 0.504 | 0.490 |
| PGFI | 0.429 | 0.410 | 0.387 | |
| AIC | 168.632 | 102.121 | 65.139 | |
| BIC | 274.465 | 213.246 | 181.555 | |
| CAIC | 294.465 | 23.4246 | 203.555 | |
Notation : NCP: Non-Centrality Parameter. GFI: Goodness of Fit Index. RMR: Root Mean Square Residual. RMSEA: Root Mean Square Error of Approximation. ECVI: Expected Cross Validation Index. AGFI: Adjusted Goodness-of-Fit Index. TLI: Tucker Lewis Index. NFI: Normed Fit Index. CFI: Comparative Fit Index. PNFI: Parsimonious Normed Fit Index. PGFI: Parsimony Goodness-of-Fit Index. AIC: Akaike Information Criterion. BIC: Bayesian Information Criterion. CAIC: Consistent Akaike Information Criterion.
The values in this second model produce a statistically significant reduction in Chi-square (χ2(1)=68.51). Furthermore, it shows an improvement in practically all the index adjustments. For instance, GFI increases from 0.964 to 0.983, RMSEA is reduced to 0.045, and the ECVI to 0.070 (PGFI is the only factor which does not show signs of better behaviour in Model II (rather than Model I). On the other hand, all causal relationships in Model 1 are still significant, as is the causal relationship included in Model II. Thus, the perceived quality of service not only has a positive impact on student satisfaction mediated by a willingness to continue studying, but also a direct impact. The modification indices will now be examined, noting that the highest one concerns the causal relationship between quality and willingness to recommend. As before, the decision was taken to include this causal relationship and reestimate the model, now referred to as M III.
This third model produces a statistically significant chi-square value of 21.139 ( p = 0.098), with a GFI of 0.994, an RMSEA of 0.016, and an ECVI of 0.044. Therefore, a significant reduction in chi-square is produced (χ2(1)=38.98) and an improvement of all absolute and incremental fit measures (table 8.98). The parsimony indices show varied behaviour, three of them improve their result while two do not. Evaluating all aspects, it is considered relevant to incorporate this modification in the model, thus improving all absolute and incremental fit measures, in particular chi-square (which becomes significant), and because this causal relationship is, in itself, statistically significant. Thus it can be concluded that quality also has a direct and positive impact on willingness to recommend the course to others. After testing this model, no index is above 10 and the remaining indices do not show statistically and theoretically significant improvements.
Table 3
Relationship Between Variables: Model III
| Causal relationships | Estimated coefficient | Stand. error | Estimated standard coefficient | Critical ratio (t) | Sig. |
| Teaching service → quality | 0.35 | 0.014 | 0.50 | 23.988 | 0.000 |
| Administrative services → quality | 0.22 | 0.013 | 0.33 | 16.767 | 0.000 |
| Additional services → quality | 0.15 | 0.012 | 0.23 | 12.000 | 0.000 |
| User interface → quality | 0.20 | 0.013 | 0.30 | 15.066 | 0.000 |
| Quality → Satisfaction | 0.43 | 0.030 | 0.40 | 14.319 | 0.000 |
| Teaching service → Satisfaction | 0.14 | 0.017 | 0.20 | 8.373 | 0.000 |
| Administrative services → Satisfaction | 0.16 | 0.015 | 0.22 | 10.177 | 0.000 |
| Additional services → Satisfaction | 0.11 | 0.013 | 0.16 | 8.395 | 0.000 |
| User interface → Satisfaction | 0.12 | 0.015 | 0.17 | 8.138 | 0.000 |
| Satisfaction→ Loyalty | 0.40 | 0.031 | 0.40 | 12.599 | 0.000 |
| Satisfaction → Willingness to recommend | 0.35 | 0.031 | 0.30 | 11.539 | 0.000 |
| Loyalty → Willingness to recommend | 0.53 | 0.032 | 0.45 | 16.476 | 0.000 |
| Quality → Loyalty | 0.31 | 0.030 | 0.28 | 10.437 | 0.000 |
| Quality → Willingness to recommend | 0.20 | 0.031 | 0.16 | 6.641 | 0.000 |
The above table shows the statistical significance and intensity of the relationships between the variables included in the third model. As can be seen, all relationships are statistically significant. In particular, the perceived quality of service is influenced by the four dimensions of the scale: the core or teaching service 37%, the administrative services 24%, the complementary or additional services 17%, and the user interface 22%. Furthermore, the four dimensions also affect satisfaction, as does the perceived quality of service itself. The PSQ has the highest explanatory power (35%), while the dimensions of the direct scale have a lesser explanatory power, specifically of 17%, 19%, 14%, and 15% with reference to the first, second, third, and fourth dimension, respectively. On the other hand, it also shows that the continuance intention (loyalty) is not only directly affected by satisfaction, but also by the perceived quality of service, although satisfaction carries greater relative weight (58% to 42%). Similarly, it is noted that the willingness to recommend the service is particularly influenced by student willingness to continue studying (a ratio comparative to 50%), but additionally by the level of satisfaction with the service (33%) and, as indicated by the model, by the perceived quality of service (17%), although this exerts a lower level of relative influence.
Finally, considering the R-squared value of multiple regression analysis as an indicator of the explanatory power of the model in relation to each endogenous variable, it is demonstrated that the model has an explanatory power of 50% of perceived quality of service, 52% of satisfaction, 38% of loyalty, and 62% for the willingness to recommend the course to third parties.
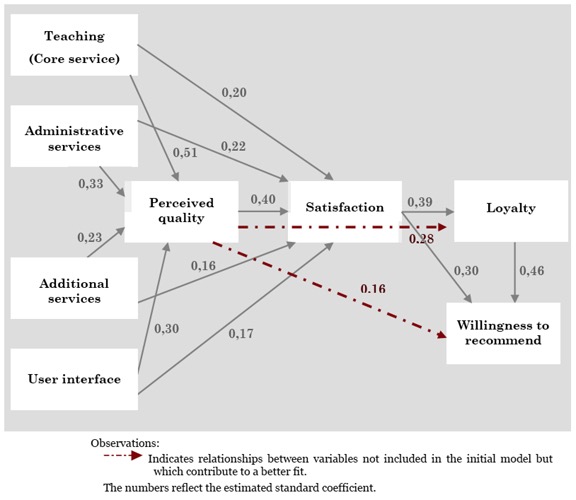
Figure 2. Structural model of relationships between the key variables.
Through analysis of the structural equations developed, the established hypotheses have been validated. Furthermore, this has highlighted the direct, positive, and statistically significant impact of perceived quality of service on the willingness not only to continue studying, but also to recommend the course to others.
Until recently, universities had not paid much attention to student loyalty. For historic reasons, the focus was more on attracting students rather than managing the student experience (DeShields et al., 2005). However, as universities face an increasingly competitive sector they are beginning to realise the vital need for student loyalty.
On the other hand, more and more universities are offering all or part of their degree courses online. Customer loyalty is compromised in a virtual learning environment due to the notable lack of physical interaction, making it even more elusive.
This paper demonstrates the importance of student perceptions of service quality (PSQ) for a wholly online university as it is a key element in both loyalty and willingness to recommend. The relationship established in the literature (for instance, Spreng, MacKenzie, & Olshavsky, 1996) between the constructs of service quality, satisfaction, loyalty, and willingness to recommend the service in an offline environment can also be seen in the context of virtual higher education. This is despite the peculiarities of the process of providing educational services in a virtual environment, such as the absence of face-to-face interaction between student and teacher, the lack of conventional tangible elements which act as benchmarks for quality of service, the difficulties in meeting expectations or the need for active participation in service provision, and student computer skills, among others.
With regards to the relationship between quality and satisfaction, it is worth emphasizing that, in contrast with what other studies suggest (for instance, Cronin, & Taylor, 1992; Dabholkar & Thorpe, 1994; Oliver, 1980; Rust & Williams, 1994), perceived quality of service is shown to have a direct impact on student loyalty and willingness to recommend and not only an indirect influence, or mediated, through the level of satisfaction. In light of these correlations, the quality of service perceived by itself is a key aspect in improving the loyalty of students and their desire to promote the course in a specific university.
This study takes a holistic view of service quality, which does not focus exclusively on an assessment of teaching and learning processes. Additionally, it has taken into account: (a) administrative services, concerning the administrative processes which, as Grönroos (1990) states, while supplementary, are vital to providing the core service: the teaching; (b) The complementary or additional services -such as the job bank and the library; and (c) the virtual learning environment or user interface, which Zeithaml & Parasuraman (2004) and Parasuraman et al. (2005) describe as reliability or system availability. The four dimensions are found to significantly affect student perception of service quality, with the one concerning the teaching being the most relevant, from an individual point of view. Furthermore, all have a significant influence on student satisfaction, with the administrative services having a higher relative importance in this case. It is very important to note that considered as a whole, non-instructional services (administrative services, additional services, and user interface) have a higher impact on students’ PSQ and satisfaction than teaching or core services. Therefore, the management of these non-instructional aspects is indispensable to ensure loyalty and willingness of students to recommend.
This paper demonstrates that a relationship exists between perceived quality of service and satisfaction and, in turn, between these constructs and student loyalty and willingness to recommend studying a course in an e-learning environment. Therefore, in order for a university to ensure its survival and viability, it is essential to establish a quality management system which allows access to consistent information on the level of service quality which is offered to students and, at the same time, to institute a continuous improvement program. Elaborate the purpose of a quality management system; it monitors PSQ with a view to cultivating loyalty that promotes recruitment and retention of students, and thereby contributes to a university's sustainability.
The analysis has benefited from the participation of a large number of students, who enrolled in various programs (management, law, engineering, and so on) but all from the same university, the UOC. In future research it would be interesting to test if these findings are the same whether applied to other universities as well as online on-job and vocational training.
Agrawal, A, & Tan, V.M. (2014). Exploring determinants of students’ experience, perceptions and loyalty intentions in higher education institutions. International Journal of Management in Education, 8(4), 343-356.
Aldridge, S., & Rowley, J. (1998). Measuring customer satisfaction in higher education. Quality Assurance in Education, 6(4), 197-204.
Alves, H., & Raposo, M. (2010). The influence of university image on student behaviour. International Journal of Educational Management, 24(1), 73-85.
Ambroggio, G. (2000). El primer año en la Universidad y la permanencia en la carrera. Cuadernos de Educación, 1, 133-143.
Amstrong, J.S., & Overton, T.S. (1977). Estimating Non response Bias in Mail Surveys. Journal of Marketing Research, 14, 396-402.
Anderson, E.W., & Mittal, V. (2000). Strengthening the satisfaction-profit chain. Journal of Service Research, 3(2), 107-120.
Anderson, E.W., & Sullivan, M.W. (1993). The antecedents and consequences of customer satisfaction for firms. Marketing Science, 12(2), 125-143.
Baker, R.W., McNeil, O.V., & Siryk, B. (1985). Expectation and reality in freshman adjustment to college. Journal of Counseling Psychology, 32(1), 94-103.
Batalla-Busquets, J.M. & Martínez-Argüelles, M.J. (2014). Determining factors in online training in companies. International Journal of Management Education, 12(2), 68-79.
Bers, T.H., & Smith, K.E. (1991). Persistence of community college students. The influence of student intent and academic and social integration. Research in Higher Education, 32(5), 539-556.
Bigné, E., Sánchez, M.I., & Sánchez, J. (2003). SERVQUAL reliability and validity in travel agencies. Annals of Tourism Research , 30(1), 258-262.
Bitner, MJ. (1990). Evaluating services encounters: the effects of physical surroundings and employee responses. Journal of Marketing, 54(2), 69-82.
Bolton, R.N. (1998). A dynamic model of the duration of the customer's relationship with a continuous service provider: The role of satisfaction. Marketing Science , 17(1), 45-65.
Bolton, R.N., & Drew, J.H. (1991). A longitudinal analysis of the impact of service changes on customer attitudes. Journal of Marketing, 55(1), 1-9.
Byrne, B.M. (2001). Structural equation modeling with AMOS: Basic concepts, applications, and programming. New Jersey: Lawrence Erlbaum, Inc. Publishers.
Chell, E. (1998). Critical incident technique. In G. Symon & C. Cassell (Eds.). Qualitative methods and analysis in organisational research: A practical guide. London: Sage Publications.
Chong, Y.S., & Ahmed, P.K. (2015). Student motivation and the ‘feel good’ factor: An empirical examination of motivational predictors of university service quality evaluation. Studies in Higher Education, 40(1), 158-177.
Chow, W.S., & Shi, S. (2014). Investigating students’ satisfaction and continuance intention toward e-learning: an extension of the expectation – confirmation model. Procedia - Social and Behavioral Sciences, 141, 1145–1149.
Cox, J., & Dale, B.G. (2001). Service quality and e-commerce: An exploratory analysis. Managing Service Quality, 11(2), 121-131.
Cronin, J.J., & Taylor, SA. (1992). Measuring service quality: A reexamination and extension. Journal of Marketing, 56(3), 55-68.
Dabholkar, P.A. (2000). Technology in service delivery: Implications for selfservice and service support. In T.A. Swartz & D. Iacobucci (Eds.), Handbook of services marketing and management (pp 103-110). Thousand Oaks: Sage Publications.
Dabholkar, P.A., & Thorpe, D.I. (1994). Does customer satisfaction predict postpurchase intentions? J ournal of Consumer Satisfaction, Dissatisfaction and Complaining Behavior , 7, 161-171.
Dehghan, A., Dugger, J., Dobrzykowski, D., & Balazs, A. (2014). The antecedents of student loyalty in online programs. International Journal of Educational Management, 28(1), 15-35
Deil-Amem, R. (2011). Socio-academic integrative moments: Rethinking academic and social integration among two-year college students in career-related programs. The Journal of Higher Education, 82(1), 54-91
DeShields, Jr. J., Kara, A., & Kainak, E. (2005). Determinants of business students satisfaction and retention in higher education: Applying Herzberg’s two factor theory. International Journal of Educational Management , 19(2), 128-135.
Dick, A.S., & Basu, K. (1994). Customer loyalty: Toward an integrated conceptual framework. Journal of the Academy of Marketing Science, 22(2), 99-113.
Gallifa, J., & Batallé, P. (2010). Student perceptions of service quality in a multi-campus higher education system in Spain. Quality Assurance in Education, 18(2), 156-170.
Grönroos, C. (1990). Relationship approach to marketing in service contexts: The marketing and organizational behavior interface. Journal of Business Research, 20, 3-11.
Hill, Y., Lomas, L., & MacGregor, J. (2003). Students’ perceptions of quality in higher education. Quality Assurance in Education, 11(1), 15-20.
Iacobucci, D., Grayson, K., & Omstrom, A. (1994). The calculus of service quality and customer satisfaction: Theoretical and empirical differentiation and integration. In T. A. Swartz, D. E. Bowen, & S. W. Brown (Eds.), Advances in Services Marketing and Management (pp. 16-84). Greenwich, CT: JAI Press.
Joseph, M., & Joseph, B. (1997). Service quality in education: A student perspective. Quality Assurance in Education, 5(1), 15-21.
Joseph, M., Yakhou, M., & Stone, G. (2005). An educational institution’s quest for service quality: Customers’ perspective. Quality Assurance in Education, 13(1), 66-82.
Kwan, P.Y.K., & Ng, P.W.K. (1999). Quality indicators in higher education – comparing Hong Kong and China’s students. Managerial Auditing Journal, 14(1/2), 20-27.
LeBlanc, G., & Nguyen, N. (1997). Searching for excellence in business education: An exploratory study of customer impressions of service quality. The International Journal of Educational Management, 11(2), 72-79.
Lee, M. (2010). Explaining and predicting users’ continuance intention toward e-learning: An extension of the expectation–confirmation model. Computers & Education, 54, 506–516.
Li, R.Y., & Kaye, M. (1998). A case study for comparing two service quality measurement approaches in the context of teaching in higher education. Quality in Higher Education, 4(2), 102-113.
Lovelock, C. H., & Wirtz, J. (2004). Service marketing: People, technology, strategy. New Jersey: Prentice Hall.
Martínez-Argüelles, M.J., Blanco, M., & Castán, J.M. (2014). Dimensions of Perceived Service Quality. Universities and Knowledge Society Journal, 10(1), 89-106.
Martensen, A., & Dahlgaard, J.J. (1999). Strategy and planning for innovation management -supported by creative and learning organisations. International Journal of Quality & Reliability Management, 16(9), 878-891.
Marzo-Navarro, M., Pedraja, M., & Rivera-Torres, M.P. (2005). Measuring customer satisfaction in summer courses. Quality Assurance in Education, 13(1), 53-65.
Meuter, M.L., Ostrom, A.L., Roundtree, R.I., & Bitner, M.J. (2000). Self-service technologies: Understanding customer satisfaction with technology-based service encounters. Journal of Marketing, 64(3), 50-64.
Oldfield, B.M., & Baron S. (2000). Student perceptions of service quality. Quality Assurance in Education, 8(2), 85-95.
Oliver, R.L. (1980). A cognitive model of the antecedents and consequences of satisfaction decisions. Journal of Marketing Research, 17(4), 460-469.
Oliver, R.L. (1981). Measurement and evaluation of satisfaction process in retail settings. Journal of Retailing, 57(3), 25-48.
Oliver, R.L. (1993). Cognitive, affective, and attribute bases for satisfaction. Journal of Consumer Research , 20(3), 418-30.
O’Neill, M., & Palmer, A. (2004). Importance-performance analysis: A useful tool for directing continuous quality improvement in higher education. Quality Assurance in Education, 12(1), 39-52.
Owlia, M.S., & Aspinwall, E.M. (1998). A framework for measuring quality in engineering education. Total Quality Management , 9(6), 501–518.
Pal, S. (2012). Mining educational data to reduce dropout rates of engineering students. International Journal of Information Engineering and Electronic Business, 2, 1-7.
Parasuraman, A., Zeithaml, V.A., & Berry, L.L. (1988). SERVQUAL: A multiple-item scale for measuring consumer perceptions of service quality. Journal of Retailing, 64(1), 12-39.
Parasuraman, A., Zeithaml, V.A., & Maholtra, H. (2005). E-S-QUAL: A multiple-item scale for assessing electronic service quality. Journal of Service Research, 7(3), 213-233.
Parves, S., & Ho, Y.W. (2013). Antecedents and consequences of service quality in a higher education context. A qualitative research approach. Quality Assurance in Education, 21(1), 70-95.
Phelan, L. (2012). Interrogating students’ perceptions of their online learning experiences with Brookfield’s critical incident questionnaire. Distance Education, 33(1), 31-44.
Reichheld, F.F. (1994). Loyalty and the renaissance of marketing. Marketing Management, 2(4), 10-22.
Reichheld, F.F., & Schefter, P. (2000). E-loyalty: Your secret weapon on the web. Harvard Business Review, 78(4), 105-113.
Rivas, R.M., Sauer, P.L., Glynn, J.G. & Miller, T.E. (2007). Persist/dropout differences in pre-matriculation attitudes of freshman towards college attrition: A longitudinal multiple group structural equations model. College Teaching Methods & Styles Journal, 3(3), 55-68
Russell, M. (2005). Marketing education: A review of service quality perceptions among international students. International Journal of Contemporary Hospitality Management, 17(1), 65-77.
Rust, RT., & Williams, DC. (1994). How length of patronage affects the impact of customer satisfaction on repurchase intention. Journal of Consumer Satisfaction, Dissatisfaction, and Complaining Behavior, 7, 107-113.
Rust, R.T., Zahorik, A., & Kerningham, T.L. (1995). Return on quality (ROQ), making service quality financially accountable. Journal of Marketing, 59(2), 58-70.
Semeijn, J., van Riel, AC., van Birgelen, M. J., & Streukens, S. (2005). E-services and offline fulfilment: how e-loyalty is created. Managing Service Quality, 15(2), 182-194.
Sørebø, Ø., Halvari, H., Flaata Gulli, V., & Kristiansen, R. (2009). The role of self-determination theory in explaining teachers’ motivation to continue to use e-learning technology. Computers & Education, 53, 1177–1187.
Spreng, R.A., MacKenzie, S.B., & Olshavsky, R.W. (1996). A reexamination of the determinants of consumer satisfaction. Journal of Marketing, 60, 15-32
Spreng, R.A., & Mackoy, R.D. (1996). An empirical examination of a model of perceived service quality and satisfaction. Journal of Retailing , 72(2), 201-214.
Teas, K.R. (1993). Expectations, performance evaluation and consumers’ perceptions of quality. Journal of Marketing , 57(4), 18-24.
Tinto, V. (1987). Leaving college: Rethinking the causes and cures of student attrition. Chicago: The University of Chicago Press.
van Riel, A.C.R., Liljander, V., & Jurriëns, P. (2001). Exploring consumer evaluations of e-services: A portal site. International Journal of Service Industry Management, 12(4), 359-377.
Voss, R., Gruber, T., & Szmigin, I. (2007). Service quality in higher education: The role of student expectations. Journal of Business Research, 60, 949–959.
Webb, D., & Jagun, A. (1997). Customer care, customer satisfaction, value, loyalty and complaining behavior: Validation in a UK university setting. Journal of Consumer Satisfaction, Dissatisfaction and Complaining Behavior, 10, 139-151
Zeithaml, V.A., & Parasuraman, A. (2004). Service quality. Cambridge, Massachusetts: Marketing Science Institute.
Zeithaml, V.A., Parasuraman, A., & Maholtra, A. (2002). Service quality delivery through websites: A Critical review of extant knowledge. Journal of the Academy of Marketing Science, 30(4), 362-375.
![]()

Perceived Service Quality and Student Loyalty in an Online University by María-Jesús Martínez-Argüelles and Josep-Maria Batalla-Busquets is licensed under a Creative Commons Attribution 4.0 International License.