
Volume 18, Number 7
Inés Gil-Jaurena, Javier Callejo, and Yolanda Agudo
Universidad Nacional de Educación a Distancia (UNED), Spain
The paper is a study about the MOOC experience at the Spanish National University of Distance Education (UNED), where we have collected initial and final information about learners' profiles and opinions, as well as enrolment, completion and certification rates. It is a survey-based study covering 17 MOOCs offered in UNED's own platform, and collects information from a sample of more than 24000 learners (initial survey) and 2003 learners (final survey). The paper first presents an overview of the MOOC experience at UNED, introducing the main features of these courses. Afterwards, it focuses on the methodology used in the study and in the information gathered in the second edition of UNED MOOCs, which took place from November 2013 until March 2014. Learners' average profile is a Spanish female, approximately 37 years old, with a University degree, and generally employed. For many of the participants, UNED MOOCs were their first experiences with these sorts of courses, and the main reasons for enrolment were the course topic and the perceived usefulness for professional development. The expectations regarding completion and certification where initially very high, but completion rates remain below 14%. In the final survey, the overall experience in the MOOCs and the different tools used in the courses were highly valued by learners, except the support figures (curator, facilitator, peers), which received lower ratings. These findings are of interest for the institution and further research, refining learning analytics, is encouraged.
Keywords: MOOC, open education, higher education, Spain
The so-called Massive Open Online Courses (MOOCs) have become the most dominant emerging phenomenon in recent years in the field of higher education. Although the objectives have been different in different cases - institutional, promotional, advertising, etc., - the most prestigious universities in the world have created a growing and, above all, varied range of courses, both in terms of content and quality. Attentive to the development of this phenomenon, and assuming responsibility within the Spanish educational system for spearheading innovative initiatives, especially in the field of higher education distance learning, the Spanish National University of Distance Education (UNED, http://www.uned.es) has, from October 2012 onwards, launched a number of courses using this teaching modality and with significant success, in terms of the large response achieved and the number of people enrolled in the various courses that have been offered.
At the end of the second series of these courses (November 2013 to March 2014) and bearing in mind the commitment of the UNED to the quality of the courses it offers, we have made a first assessment of the experience, focusing specifically on: the analysis of the socio-demographic profile of the students of MOOCs offered by the UNED; the assessment of the MOOCs from the learners' perspective; and the analysis of the various activities of the students related to the courses (registration, completion, and certification rates).
Veletsianos and Shepherdson (2016) identify demographics of MOOC users as one of the themes that emerge across systematic analyses of the MOOC literature. This paper tries to fill one of the gaps in MOOCs literature, which is the geographic distribution - most studies about MOOCs proceed from North-American authors (Gašević, Joksimović, Kovanović, & Siemens, 2014) and refer to North-American or European (mainly UK) participants (Liyanagunawardena, Adams, & Williams, 2013), thus native English speakers. This is the first empirical analysis of one of the main MOOCs' offering university in Spain, i.e., UNED, through UNED MOOCs.
UNED's mission is the public service of higher education through the modality of distance education, characterised for utilising a specific didactical methodology by a conjoint use of printed, audiovisual, and technological media, along with face-to-face support from tutors in regional centres (more than 60 all over Spain) and communication means with professors (virtual fora, email, phone). It has the largest student population in Spain: more than 150000 registered students in Graduate programmes, almost 8000 in Master's programmes and more than 1000 in Doctorate studies, almost 13000 in the access to university course and more than 18000 in language courses in 2014-15 (UNED, 2016).
UNED has offered open educational content (especially in an audiovisual format) since its creation in 1972, joined the OpenCourseWare movement in mid-2000's and launched its first massive open online courses (MOOCs) in 2012 (Gil-Jaurena, 2014). The first institution offering MOOCs in Spain was UNED, in its pilot project launched in October 2012, UNED COMA (cursos online masivos abiertos - MOOCs), with 22 courses offered in the first edition and 25 - three of them new - in the second edition (November 2013-March 2014). The courses are in Spanish and remained open during approximately three months. Until 2015, UNED MOOCs were offered in its own platform (https://coma.uned.es/) using the openmooc software developed in Spain (https://github.com/OpenMOOC), which had the basics features for running a MOOC: infrastructure for hosting videos, online tests, peer-assessment, communication forums, and open digital badges. Given the difficulties for developing the software in order to incorporate new functionalities and keep it updated in a changing and evolving scenario, UNED analysed other alternative widespread and open source platforms; since 2015, UNED uses OpenEdx in its own server (https://iedra.uned.es/). The 17 courses on which this paper focuses were run in openmooc.
UNED MOOCs can be considered x-MOOCs, as they fall into the cognitive-behaviourist pedagogy and rely primarily on information transmission, computer marked assignments, and peer assessment (Rodriguez, 2013). Instructional design is based on providing content -mainly using videos- and proposing activities, mainly multiple choice question tests (computer marked) and other activities like peer-assessed essays, open questions, etc. According to Bates (2015), UNED MOOCs have the following design features supported by a specially designed platform software (openmooc in this case): video lectures, computer-marked assignments, peer assessment, supporting materials, a shared comment/discussion space, badges or certificates, and learning analytics. Regarding a remaining feature that this author identifies (Bates, 2015, p. 154), i.e., "no, or very light, discussion moderation," UNED MOOCs use different approaches to this aspect and two agents are in charge of supporting learners, as will be explained later, thus approaching to network-based MOOCs (Lane, 2012).
Regarding this mixture, there has been an opportunity to explore and experiment diverse pedagogical models through UNED MOOCs. Professors could use different approaches to tutoring and teacher-presence. Some professors have preferred to be actively involved in the delivery of the course, by encouraging debates in the fora, solving learners' doubts about content. Others have been actively involved in preparing material for self-learning and not so present in the delivery of the course. Regarding support to learners, besides professors-curators (authors of the contents, designers of the course, and in some MOOCs, actively involved in the implementation of the courses), there have been two different figures with active roles during the delivery of the courses: assistant tutors-facilitators (in charge of motivating and supervising debates along with professors, reordering messages, compiling FAQs, solving doubts about how to get access to the course content, about how to apply for completion certificates, etc.) and technical support staff (in charge of solving technical problems: registration, duplicated users, downloading badges and certificates, etc.) (Marauri, 2014; Gil-Jaurena, 2015).
Learners who complete the course (at least 80% of progress) have the following certification options:
Taking into account a wide variety of MOOCs of different subjects and structures, the purpose of this study is to know which dimensions and elements of MOOCs provide a satisfactory experience. What is the place of the perception of methodological design of the MOOC in such an experience? Are personal and relational aspects preferable? Is technological support more important than personal support? And what about the offered material?
In order to carry out a comprehensive evaluation of the experiences during the second series of the UNED MOOCs, the following objectives, dimensions of analysis and information sources (in parentheses) have been established:
The methodological strategy followed is based on two main principles:
The 17 courses analysed were the following (ordered by size: number of registered learners):
These 17 courses were selected among the 25 offered considering that they were 100% run by UNED with their professors. The other eight courses were developed in partnership with other institutions and had specific characteristics, this they are not part of this study.
The main characteristics of both surveys are summarised in Table 1.
Table 1
Population, Sample, Objectives and Dates of the Initial and Final MOOC Surveys
| Initial survey | Final survey | |||
| Main objective | Explore registered learners' socio-demographic profiles, expectations, and motivations for taking MOOCs | Explore learners' satisfaction with MOOCs' elements and overall satisfaction | ||
| Survey dates | November 2013 - January 2014 | December 2013 - July 2014 | ||
| MOOC (ordered by size) | Population: Learners registered in each MOOC | Sample distribution per MOOC (initial survey) | Population: Learners who have completed each MOOC | Sample distribution per MOOC (final survey) |
| Start with English | 13651 | 9356 | 2254 | 125 |
| Professional English | 8352 | 5436 | 608 | 463 |
| Accounting | 3375 | 2232 | 508 | 280 |
| ICT | 2337 | 1455 | 280 | 93 |
| Human resources | 2108 | 349 | 387 | 338 |
| Tutoring | 1532 | 1090 | 287 | 136 |
| Great works | 1284 | 775 | 235 | 141 |
| Skills1 | 1274 | -- | 224 | 98 |
| Basics of circuits2 | 1261 | 922 | 74 | -- |
| Entrepreneurship | 978 | 355 | 161 | 67 |
| Responsibility | 976 | 443 | 160 | -- |
| Happiness | 665 | 283 | 74 | 40 |
| Mini-videos | 664 | 313 | 72 | 30 |
| Logic | 650 | 312 | 44 | 26 |
| Ibervirtual | 623 | 551 | 80 | 42 |
| NPOs | 523 | 162 | 99 | 102 |
| Chemistry | 515 | 378 | 41 | 22 |
| Total population/sample | 40768 | 24412 | 5588 | 2003 |
English courses were the most popular (Basic and Professional English courses). Financial accounting and ICT were also popular. More specialised courses, such as chemistry or logic, had fewer learners, but still more than 500 in the second edition.
The gender distribution is the same in both the initial and the final surveys, being 36.4% men and 63.6% women (Figure 1). The equal distribution suggests that gender is not a relevant factor in determining whether or not the course is finished, or at least almost entirely completed. But the predominance of female learners challenges other studies that report that a majority (Ebben & Murphy, 2014) and more than 70% of participants in MOOCs (Ho et al., 2014) were males. But if we compare with learners registered in regular courses at UNED (graduate, master's, etc.), female are also a majority, as in the MOOCs (55.2% in the school year 2013-14)3. The skew towards a female majority in the UNED MOOCs could be also related to the knowledge area: most MOOCs in this study belong to Social Science and Humanities areas, where females are more present, as opposed to STEM courses where males are majority. As reported by Jiang, Schenke, Eccles, Xu and Warschauer (2016), only 23.89% females were enrolled in the Harvardx and MITx STEM MOOCs in 2012-13.
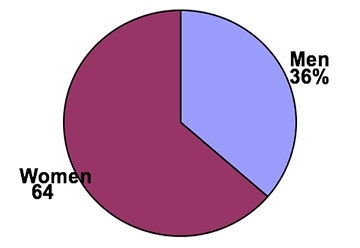
Figure 1. Distribution of samples by gender.
The average age of those completing the initial questionnaire is 36.17 years; while for those completing the final survey the average age rises slightly to 37.89 years, almost two years more. Worth mentioning the presence, even if the percentages are very low, of people under 18 and also of elderly people carrying out the courses, although the bulk of the students are found in the middle age ranges, especially between the ages of 31 and 45 (Figure 2). However, Table 2 shows that the age group that is most likely to complete a substantial part of the course -given indirectly by the completion of the final questionnaire of the course- is the group of students between 46 and 60 years of age.
Table 2
Age Groups of the Participants in the Surveys on the MOOCs
| Age groups (%) | ||
| Initial n=24412 | Final n=2003 | |
| Less than 18 | .4 | .3 |
| 18-30 years | 36.2 | 29.5 |
| 31-45 years | 42.7 | 45.2 |
| 46-60 years | 18.8 | 23.0 |
| More than 60 | 1.8 | 2.0 |
| Total | 100.0 | 100.0 |
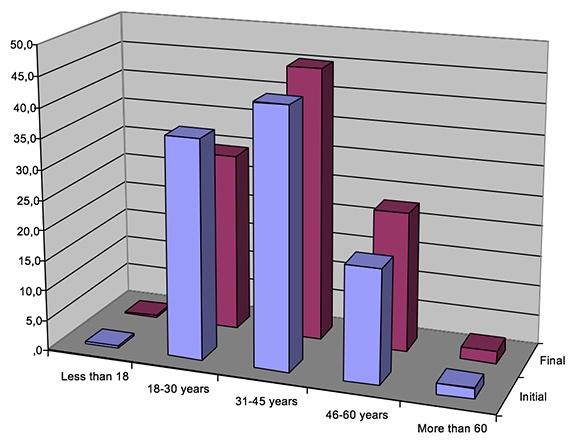
Figure 2. Distribution of respondents by age group and initial/final survey.
By nationality, almost four out of five of those responding to the initial questionnaire reside in Spain (79.5%). When referred to the general MOOC offer in the world, Oliver, Hernández-Leo, Daza, Martín, and Albó (2014), explain how "from the demand side, Spain also stands within the top-five countries with more participants, right after USA, UK, Canada and Brazil" (p. 5).
It is important to note the presence among those surveyed of residents from other Spanish-speaking countries: 2.8% Argentinians, 4.7% Colombians, 3.7% Mexicans, 1.4% Peruvians, 0.9% Chileans, 0.6% Venezuelans, and 0.7% from other Spanish-speaking countries. If these figures are added to the previous figure, it can be seen that residents of Spanish-speaking countries make up almost all of the students.
In the sample of students who completed the final questionnaire, the vast majority (89.3%) are resident in Spain, while the 1.9% residing in Mexico and 1.6% in Colombia are also worth highlighting.
The majority of people who have attended the UNED MOOCs are either currently studying or have completed higher, university-level education (Table 3). This result is in accordance with findings reported by other authors (Emanuel, 2013; Ho et al. 2014; Jordan, 2014; Bates, 2015). The persistence in MOOCs only achievable for privileged learners (those who have previously attained higher education qualifications) has been identified by Schuwer et al. (2015) as an example of inequality in access to education, and as one of the threats of MOOCs on the macro level.
Table 3
Percentage Distribution of Samples by Level of Education (Completed or in Progress)
| Initial n=24412 | Final n=2003 | |
| No studies | .1 | |
| Basic/primary education | 1.9 | 1.1 |
| Secondary education | 4.7 | 1.5 |
| High school | 11.1 | 6.5 |
| Vocational training | 17.6 | 10.4 |
| University level | 52.5 | 59.5 |
| Postgraduate studies | 12.0 | 21.0 |
| Total | 100.0 | 100.0 |
In view of these distributions, and if we assume that those who have completed the final questionnaire have more or less satisfactorily completed their respective courses, we can see there is greater likelihood of this completion occurring for those who are either currently studying or have completed higher education than for those who have achieved a lower level of education (Figure 3).
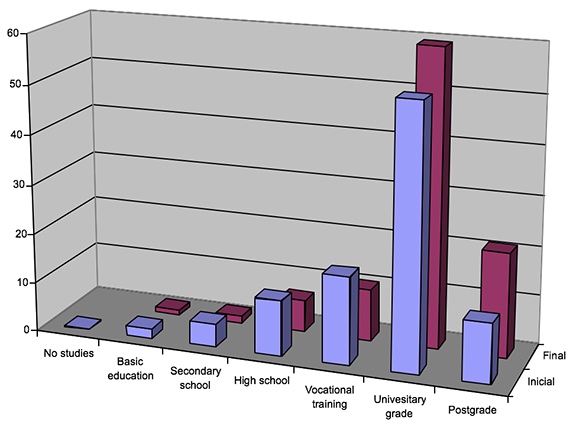
Figure 3. Respondents by level of education and initial/final survey.
Regarding employment status, those making up the initial sample and, generalising, the body learners enrolled in the MOOC courses analysed, are mainly employees (35.2%) and unemployed (36.3%) (Figure 4). Students make up the third largest group with 19%. Self-employed represent just 7.7% of the total; but their high presence in some of the courses, such as the Mini-Videos and Social Responsibility courses, should be highlighted (Table 4).
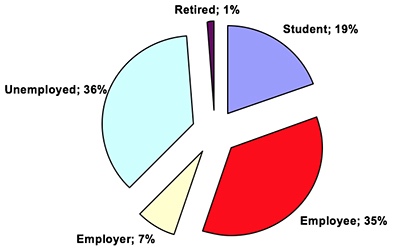
Figure 4. Respondents by employment status in initial survey.
Table 4
Learners' Employment Status (%)
| Student | Employee | Self-employed | Unemployed | Retired | Total | |
| Start with English | 17.1 | 37.1 | 7.8 | 35.4 | 2.5 | 100 |
| Professional English | 19.9 | 30.9 | 7.3 | 41.0 | 0.8 | 100 |
| Accounting | 15.2 | 28.5 | 7.5 | 47.9 | 0.9 | 100 |
| ICT | 19.4 | 37.4 | 8.2 | 33.4 | 1.5 | 100 |
| Human resources | 23.8 | 41.0 | 7.7 | 26.2 | 1.4 | 100 |
| Tutoring | 24.7 | 38.9 | 4.3 | 31.9 | 0.2 | 100 |
| Great works | 21.8 | 40.7 | 5.6 | 25.1 | 6.8 | 100 |
| Basics of circuits | 24.2 | 35.3 | 9.3 | 29.8 | 1.4 | 100 |
| Entrepreneurship | 22.0 | 29.3 | 8.2 | 38.7 | 1.8 | 100 |
| Responsibility | 17.5 | 36.2 | 12.7 | 33.3 | 0.2 | 100 |
| Happiness | 24.3 | 37.8 | 11.6 | 25.1 | 1.2 | 100 |
| Mini-videos | 11.5 | 47.4 | 12.9 | 25.4 | 2.8 | 100 |
| Logic | 24.1 | 36.8 | 8.8 | 28.7 | 1.5 | 100 |
| Ibervirtual | 18.4 | 47.4 | 10.7 | 21.4 | 2.0 | 100 |
| NPOs | 23.3 | 34.7 | 9.7 | 31.3 | 1.1 | 100 |
| Chemistry | 31.3 | 26.0 | 2.7 | 38.7 | 1.3 | 100 |
| Total | 19 | 35.2 | 7.7 | 36.3 | 1.8 | 100 |
Summarising, concerning learners' profile, enrolment information and results from the initial survey say that there is a majority of women, with a high level of education and either unemployed or employed. Most of the enrolled learners are in Spain (more than 90%). Other learners are in Mexico, Colombia, Argentina, or European countries.
Of the enrolled students who participated in the initial questionnaire, 70.5% stated that this was their first MOOC experience with the UNED open courses, while 8.3% had had only one previous experience. As little as 3% come to these courses with prior experience involving three or more courses of this sort. Therefore, it is fair to say that for the majority this opportunity represents their only point of reference regarding the MOOCs experience.
In terms of previous experience in COMA/MOOC courses, 9% have had this in different UNED platforms. However, 7% of the total sample have already tried the UNED-COMA courses themselves. This is followed by 4% for MiriadaX and just under 4% for Coursera.
Bearing in mind that an average of 2.5 reasons for embarking on the UNED MOOC courses analysed was identified by respondents, the most common of these are interest in course content, subject, and expected usefulness of this subject for professional development. The first of these reasons is given by almost 72% of participants in the initial survey; while the second is given by 60.6%. It should be borne in mind that a third (33.8%) give the two reasons together. In fact, between the two they account for 51% of the total collected answers. This is shown in Table 5.
Table 5
Reasons for Enrolment
| Answers | Percentage | Percentage of cases |
| I am interested in the subject/topic of the course | 28.3% | 71.8% |
| I find that the course methodology suits me | 12.0% | 30.4% |
| I am interested in obtaining a certificate | 10.3% | 26.1% |
| The course is useful for my professional development | 23.9% | 60.6% |
| For me, the prestige of the UNED is a reason to take a course in this institution | 11.1% | 28.3% |
| I am interested in accessing specific contents of the course | 5.6% | 14.1% |
| I am interested in interacting with other students with whom I share interests | 3.2% | 8.2% |
| I am interested in having access to expert teachers in the subject | 5.6% | 14.3% |
| Total (n=24412) | 100.0% | 253.8% |
*Note. a. Dichotomy group tabulated at value 1.
Looking beyond the subject of each specific course, it should be noted that 30% of participants in the questionnaire have selected the fact that the course methodology suited them as a reason for taking part in this experience. This is relatively independent of what is meant by the concept of methodology in this case: Distance learning? Free? Short courses? Participation and collaboration among peers? That is to say, there is something specific in this approach to teaching that attracts a significant number of those who have enrolled.
Given the importance of this specific reason, we will concentrate on it now. Thus, an analysis using binary logistic regression, inasmuch as this demonstrates the direct relationship with the dependent variable, putting the other variables in the model to one side and taking reason as the dependent variable, shows us the statistical significance of variables such as gender. Focusing on the latter, the probability that women indicate this option is 1.2 times more likely than it is for men. Age, however, although significant in the sense that the probability of selecting this reason increases with increasing age, is a factor of little importance. With regard to activity, it is the self-employed students who, compared with those involved in other activities, appear to be more motivated by the methodology of these courses. And, looking at the level of education, the probability of selecting this reason is significantly higher among those who have completed higher education, as would be expected. Thus, those with a university degree or equivalent, or who are studying for this, are more than twice as likely to select this option as respondents who have completed basic or primary education. Further detail and clarification is provided by Table 6, which shows the percentage of those who choose this as a reason within each of the different levels of education, independently of the regression analysis.4
Table 6
Level of Education (Completed or in Progress) by Reason for Taking this Course Cross-Tabulation: I Find That the Course Methodology Suits Me*
| Level of education (completed or in progress) | [I find that the course methodology suits me] Reason for taking this course | Total | |
| Non selected | Yes | ||
| No studies | 87.0% | 13.0% | 100.0% |
| Basic /primary education | 81.4% | 18.6% | 100.0% |
| Secondary education | 75.8% | 24.2% | 100.0% |
| High school | 73.1% | 26.9% | 100.0% |
| Vocational training | 75.6% | 24.4% | 100.0% |
| University level | 67.6% | 32.4% | 100.0% |
| Postgraduate studies | 63.6% | 36.4% | 100.0% |
| Total (n=24412) | 69.8% | 30.2% | 100.0% |
* Asymptotic significance (two tails) of Pearson's Chi-Square<.000
Finally, we would draw attention to the 28% who have selected the prestige of the UNED as a reason.
What do the people enrolled in the UNED MOOCs expect from them? What are their expectations? The majority of the answers focus on obtaining the credential. In a credentialist society it is the certificate that counts, to the extent that four out of five people enrolled in the courses point to the credential as the objective for taking the course (Table 7).
Table 7
Expectations on Taking This Course
| Percentage | |
| My intention is to consult the materials but I don't expect to complete the course | 1.2% |
| I expect to do some of the activities but I don't think I will complete the entire course | 2.4% |
| I expect to finish the entire course but I don't intend to request any certificate | 18.2% |
| I expect to complete the course and request the corresponding credential and/or certificate | 78.3% |
| Total (n=24412) | 100.0% |
This pursuit of the credential accounts for as many as 92% of those enrolled in the MOOC on "School tutoring," 88% of those in the course "ICT for teaching and learning" and 87% of those in "Entrepreneurship and Social innovation." Where this expectation has least relative weight is in the "Corporate Social Responsibility" course, where it has not been selected by anyone, although in this case the sample base is very low. The next course where this aspect has relatively low importance is "Logic and uses," with 67% selecting it.
However, in contrast with these high expectations regarding completion of courses and requesting the corresponding certificate, the average course completion rate stands at 13.71% of those who enrol, and the application for certificates at 19.31% of those who complete the course, as reflected in Table 8. This difference between expectations and completion rates in MOOCs has been previously reported; as Reich (2014) stated, "the majority of students who intended to complete a course -in some cases the overwhelming majority of students - were not successful in doing so." (para. 22)
With regard to the behaviour of students, the most relevant data regarding enrolment, commencement, completion, and requesting of the certificate for each course are given in Table 8.
Table 8
Enrolment, Commencement, Completion and Certification Rates by MOOC
| MOOC | Learners enrolled | Learners who have started each course | Learners who have completed each course (from enrolled) | Learners who have paid for a digital credential or certificate | ||||
| Total | % from enrolled | % from completed | ||||||
| Start with English | 13651 | 11.546 | 84.58% | 2254 | 16.51% | 132 | 0.97% | 5.86% |
| Professional English | 8352 | 6.396 | 76.58% | 608 | 7.28% | 197 | 2.36% | 32.40% |
| Accounting | 3375 | 2.411 | 71.44% | 508 | 15.05% | 147 | 4.36% | 28.94% |
| ICT | 2337 | 1.653 | 70.73% | 280 | 11.98% | 82 | 3.51% | 29.29% |
| Human resources | 2106 | 1.518 | 72.08% | 387 | 18.38% | 106 | 5.03% | 27.39% |
| Tutoring | 1532 | 1.138 | 74.28% | 287 | 18.73% | 105 | 6.85% | 36.59% |
| Great works | 1284 | 1.007 | 78.43% | 235 | 18.30% | 58 | 4.52% | 24.68% |
| Skills | 1274 | 833 | 65.38% | 224 | 17.58% | 34 | 2.67% | 15.18% |
| Basics of circuits | 1261 | 1.132 | 89.77% | 74 | 5.87% | 13 | 1.03% | 17.57% |
| Entrepreneurship | 978 | 551 | 56.34% | 161 | 16.46% | 37 | 3.78% | 22.98% |
| Responsibility | 976 | 668 | 68.44% | 160 | 16.39% | 63 | 6.45% | 39.38% |
| Happiness | 665 | 358 | 53.83% | 74 | 11.13% | 23 | 3.46% | 31.08% |
| Mini-videos | 664 | 459 | 69.13% | 72 | 10.84% | 21 | 3.16% | 29.17% |
| Logic | 650 | 481 | 74.00% | 44 | 6.77% | 6 | 0.92% | 13.64% |
| Ibervirtual | 623 | 450 | 72.23% | 80 | 12.84% | 18 | 2.89% | 22.50% |
| NPOs | 523 | 381 | 72.85% | 99 | 18.93% | 26 | 4.97% | 26.26% |
| Chemistry | 515 | 436 | 84.66% | 41 | 7.96% | 11 | 2.14% | 26.83% |
| Total | 40766 | 31418 | 77.07% | 5588 | 13.71% | 1079 | 2.65% | 19.31% |
About dropout rates, the average of students who start the course but don't finish it is higher than 80%. Completion rate is 13.71% (considering whole enrolment) and 17.79% if we consider only those we started the course. Despite completion rates are low, they are higher than those reported in other studies, such as a rate between 2% and 10% (Reich, 2014), 12.6% (Jordan & Weller, 2013, as cited in Weller, 2014) or average as low as 5% (Jordan, 2014). The high dropout rate and low completion rate have been identified by Schuwer et al. (2015) as a threat of the MOOC movement at the micro level.
In this final section on the final evaluations of the MOOCs we must begin by stating that 94% of those who responded have completed the course. Therefore, an overwhelming majority of the satisfaction ratings set out below are from people who have completed the courses.
The rating for what might be considered general aspects of the course is quite similar, being around eight. The most highly rated aspects are the operation of the virtual platform, the organisation and structure of the courses, and their length. The lowest rated aspect is course contents (Table 9).
Table 9
Evaluation of MOOC Elements in the Final Survey (from 1 to 10 )
| Mean | Standard deviation | |
| The virtual platform worked properly (n=1668) | 8.12 | 2.364 |
| The course was well organised / structured (n=1701) | 8.11 | 1.919 |
| The course length was adequate (n=1.693) | 8.08 | 1.789 |
| The course met my previous expectations (n=1706) | 7.72 | 1.967 |
| The course methodology was motivating and appropriate (n=1705) | 7.72 | 2.111 |
| The course contents were adequate and sufficient (n=1707) | 7.69 | 1.989 |
The variability in the evaluation of the dimensions of the course is higher when the specific elements that have been used are addressed, as shown in Table 10. Videos, tests, and self-assessments are the most highly used dimensions or materials, the fact that the first of these is close to an average rating of nine (8.94) being noteworthy. However, the different forms of personal support were the lowest used elements, neither the support of the curator (4.87), the lowest rated of all, nor that of the facilitator (5.23), nor that of peers (5.01) having been convincing. Or at least it seems that more was expected of them. This is probably logical in the case of unfamiliarity with this kind of course and its comparison with "normal" courses.
Table 10
Degree of Use of MOOCs Tools (from 1 to 10)
| n | Mean | Standard deviation | |
| Videos | 1707 | 8.94 | 1.618 |
| Complementary Material | 1692 | 8.40 | 1.952 |
| Tests, exams | 1599 | 8.62 | 1.942 |
| Self-assessments | 1589 | 8.58 | 2.038 |
| Peer-activities | 1315 | 6.27 | 3.393 |
| Support from facilitator | 1205 | 5.23 | 3.392 |
| Support from tutor-curator | 1143 | 4.87 | 3.339 |
| Support from peers | 1216 | 5.01 | 3.306 |
Students were asked about their perception of the degree of usefulness of each of these tools for the implementation of the course. The result of the responses are shown in Table 11.
Table 11
Degree of Need and Usefulness of MOOCs Tools for Learning and Progress (From 1 to 10)
| n | Mean | Standard deviation | |
| Videos | 1689 | 8.83 | 1.667 |
| Complementary Material | 1669 | 8.63 | 1.774 |
| Tests, exams | 1578 | 8.39 | 1.978 |
| Self-assessments | 1569 | 8.38 | 1.998 |
| Peer-activities | 1284 | 6.96 | 2.763 |
| Support from facilitator | 1133 | 7.16 | 2.741 |
| Support from tutor-curator | 1070 | 7.01 | 2.776 |
| Support from peers | 1153 | 6.82 | 2.794 |
Thus we see that tools that have been used and appear to be highly rated (Table 10) are also considered very useful for learning and course development (Table 11). This is the case for the videos, supplementary materials, tests, and evaluations. Meanwhile, aspects that obtained a lower rating have been considered useful as support tools. This is the case for the support of the facilitator and curator. On a third level, the evaluation of activities by peers and peer support itself (Figure 5) received a relatively low rating, and its usefulness was less highly valued than the previously mentioned aspects. These results are in agreement with those obtained in the analysis of 10 courses in another platform that offers MOOCs in Spanish, Miriadax, as reported by González and Carabantes (2017). The use and satisfaction with various MOOC tools are aligned if we consider these two studies.
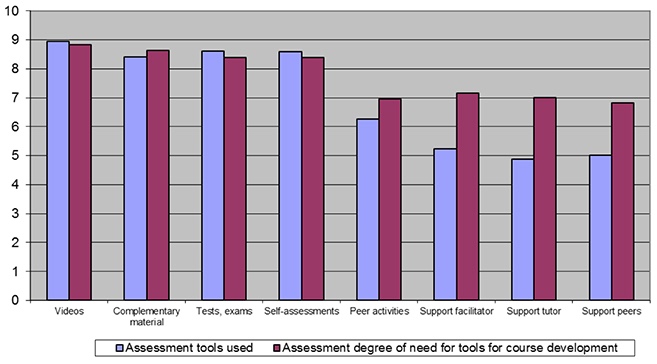
Figure 5. Assessment tools used and the degree of need for tools for course development (0-10).
In any event, the general experience seems to have been quite satisfactory, bearing in mind that, for example, the likelihood of recommending the course taken scored an average of 8.34, which can be interpreted as a high probability. Perhaps most important of all is the fact that the phrase "I would like to take more courses of this type at the UNED" was rated at 9.05. This indicates a high level of satisfaction (Table 12).
Table 12
Final General Evaluation (From 1 to 10)
| n | Mean | Standard deviation | |
| I would recommend this course to other people interested in the topic | 1722 | 8.34 | 2.098 |
| This course has allowed me to find out about the training on offer at UNED (continuing education, official degrees, etc.) | 1656 | 8.13 | 2.248 |
| I would like to take more courses of this type (MOOC) at UNED | 1693 | 9.05 | 1.585 |
| After this MOOC, I would like to take another type of course at UNED (official studies, continuing education, etc.) | 1563 | 8.14 | 2.312 |
Do these courses serve to promote the institution and the educational opportunities it offers, considering that this is one of the functions that might be assigned to the MOOCs? In the light of what is shown by the last row of Table 12, the table provides a very positive answer to this question, since 8.14 is the rating for the degree of agreement with the statement: "After completing this course, I would like to take another type of course at the UNED." Its advertising function appears to have been successful. That is to say, it serves as a point of entry -a sort of trial- for the UNED, as is also underlined by the average rating of 8.13 of the sentence: "The completion of this course has allowed me to find out about the training on offer at the UNED."
A minimal analysis of the behaviour of this dimension tells us that it has very little relation with age, with a low correlation coefficient of almost zero, with a greater weight among males (8.29) than among women (8.09), and, perhaps most important, with the highest value being reached among those with average levels of education, as shown in Table 13. Moreover, controlling the other socio-demographic variables available (sex and age), it can be said that there is a slight tendency for the rating of this aspect -the probability of taking other courses at the UNED- to decrease as level of education rises. This is something that Table 13 itself suggests.
Table 13
Future Expectations to take another course at UNED (official studies, continuing education, etc.) from 1 to 10 by Level of Education (completed or in progress)
| Mean | n | Standard deviation | |
| Basic /primary education | 8.88 | 17 | 2.472 |
| Secondary education | 9.36 | 25 | 1.287 |
| High school | 8.38 | 99 | 2.165 |
| Vocational training | 8.55 | 168 | 1.932 |
| University level | 8.11 | 927 | 2.290 |
| Postgraduate studies (master or doctorate) | 7.78 | 309 | 2.541 |
Performing a factor analysis of the principal components (Appendices 2 and 3), focusing the analysis on the first two components, tells us that the assessment of these MOOC courses is structured around two axes. The first axis relates primarily to the general aspects that have been assessed: "I would recommend this course to others interested in the subject," "The course is well organised/structured," "I have found the methodology of the course motivating and appropriate," "The course matched my expectations," or "I think that the course contents have been suitable and sufficient." The second axis involves more specific aspects, especially related to the perception of the support received, highlighting this as a relatively key dimension when it comes to assessment, almost like a demand. Thus, in this axis the assessment of the role that the support of peers, facilitator, and curator played in the course has special weight.
Still bearing in mind these two axes, what is their relationship with fostering an interest in taking other courses at the UNED? Through the correlations in the matrix of components (Appendix 2), this relationship can be seen. That is to say, the correlation with the first axis, or general aspects, has a fairly high correlation (0.659, being p<0.01); while in the second axis it has much less weight. Meanwhile, the correlation of the variable that denotes interest in taking other courses at the UNED and variables that reflect the assessment of the support (facilitator, curator, and peers) received during the course is low, not reaching 0.3 under any circumstances. Also, if we take into account, not so much the evaluation of these tools in the course taken but the evaluation of their usefulness in this type of course, we can see that the correlation with the variable representing interest in taking other courses in the UNED is still low, reaching a peak of 0.321 for the support of the curator.
The main results have been presented in the previous section. Below is a summary of those aspects that are of particular interest for finalising the details of the next series of MOOCs and for their evaluation.
At the institutional level, the results of the analysis demonstrate the existence of a high level of interest in this type of course, as well as high expectations and the demand for more similar courses. As a way of attracting potential students, we must recognise and take advantage of MOOCs as a point of entry to the UNED, bearing in mind that it is the first contact with the institution for most of those who enrol in these courses. Linking these courses with other UNED academic courses (lifelong learning, regulated studies, etc.) could meet the demand of the students and might result in the sustainability of the project. In this sense, UNED regulated the approval of new MOOCs according to some criteria, among them the relation with other educational offer in the institution (Gil-Jaurena, 2015). It would be useful to continue the evaluation, analysis, and research on MOOCs offered by the UNED. In particular, aspects such as the difference between the expectations and the actual rates of completion of courses or the predominantly well-educated profile of the users are striking and require specific studies.
At a pedagogical level, although in general the methodology and materials in the MOOCs have been positively valued, we must rethink the personal support roles (curator, facilitator), which have been the least highly used and rated by the learners. Independent studies about each MOOC considering their pedagogical specificities (more video-based, more social interaction-based, etc.) would lead to refining the analysis and providing valuable recommendations for teachers, instructional designers, and the institution itself.
Another important issue relates to the identification and better knowledge of learners in different MOOCs or knowledge areas: who they are, which motivations and expectations they present when they approach MOOCs, which use they make of the resources, what other needs they show, etc. Besides the profile, information about the learning paths that students follow is also of great interest in order to improve the learning experience and reduce attrition rates. A more complex and accurate learning analytics system would be recommended. Clustering (Khalil, Kastl, & Ebner, 2016) is an example of analysis we would use to reveal patterns and study the correlation between learners' behaviours, engagement, and completion rates. In this regard, a reconsideration of the automated measures from a pedagogical perspective is needed, in line with the position held by DeBoer, Ho, Stump, and Breslow (2014). Finally, a deeper analysis of the dimensions that influence learners' evaluation and satisfaction with MOOCs would be of interest in order to design and offer effective MOOCs and other online courses in the near future.
This study has been supported by the UNED OER programme (UNED Abierta) and by the Office of the Vice President of Quality and Internationalisation, VIII Call for Proposals for Research Networks for Educational Innovation: Development of Pilot Projects to improve teaching quality in the European Higher Education Area (academic year 2014/2015).
Bates, T. (2015). Teaching in a digital age. Guidelines for designing teaching and learning. Vancouver: Tony Bates Associates Ltd. Retrieved from https://opentextbc.ca/teachinginadigitalage/
DeBoer, J., Ho, A. D., Stump G., & Breslow, L. (2014). Changing "Course" reconceptualizing educational variables for massive open online courses. Educational Researcher, 43(2), 74-84. doi: http://dx.doi.org/10.3102/0013189X14523038
Ebben, M., & Murphy, J. S. (2014). Unpacking MOOC scholarly discourse: A review of nascent MOOC scholarship. Learning, Media and Technology, 39(3), 328-345. doi: http://dx.doi.org/10.1080/17439884.2013.878352
Emanuel, E. J. (2013). Online education: MOOCs taken by educated few. Nature, 503(342). doi: http://dx.doi.org/10.1038/503342a
Gašević, D., Joksimović, S., Kovanović, S., & Siemens, G. (2014). Where is research on massive open online courses headed? A data analysis of the MOOC Research Initiative. International Review of Research in Open and Distance Learning, 15(5). Retrieved from http://www.irrodl.org/index.php/irrodl/article/view/1954/3099
Gil-Jaurena, I. (2014, April). Open educational policies and practices in the Spanish National Distance Education University: UNED Abierta (UNED OER programme). OCWC Global Conference 2014 Proceedings. Open Education for a multicultural world, Ljubljana (Slovenia). Retrieved from http://conference.ocwconsortium.org/2014/wp-content/uploads/2014/02/Paper_58-UNED1.pdf
Gil-Jaurena, I. (2015). MOOCs in Spain: Preliminary lessons from UNED MOOCs experience. In B. Kim (Coord.). MOOCs and educational challenges around Asia and Europe (pp. 191-204). Seoul: KNOU Press.
González de la Fuente, Á., & Carabantes Alarcón, D. (2017). MOOC: medición de satisfacción, fidelización, éxito y certificación de la educación digital [MOOCs: measuring satisfaction, loyalty, success and certification of digital education]. Revista Iberoamericana de Educación a Distancia, 20(1), 105-123. doi: http://dx.doi.org/10.5944/ried.20.1.16820
Ho, A. D., Reich, J., Nesterko, S., Seaton, D. T., Mullaney, T., Waldo, J., & Chuang, I. (2014). HarvardX and MITx: The first year of open online courses. HarvardX and MITx Working Paper No. 1. doi: http://dx.doi.org/10.2139/ssrn.2381263
Jiang, S., Schenke, K., Eccles, J. S., Xu, D., & Warschauer, M. (2016). Females' enrollment and completion in science, technology, engineering, and mathematics Massive Open Online Courses. arXiv preprint. Retrieved from https://arxiv.org/pdf/1608.05131
Jordan, K. (2014). Initial trends in enrolment and completion of massive open online courses. The International Review of Research in Open and Distributed Learning, 15(1). Retrieved from http://www.irrodl.org/index.php/irrodl/article/view/1651
Khalil, M., Kastl, C., & Ebner, M. (2016). Portraying MOOCs learners: A clustering experience using learning analytics. Proceedings of the European MOOC Stakeholder Summit 2016, 265-278. Retrieved from http://emoocs2016.eu/wp-content/uploads/2016/02/proceedings-emoocs2016.pdf
Lane, L. (2012, August 15). Three kinds of MOOCs. Lisa's (online) Teaching & History Blog. Retrieved from http://lisahistory.net/wordpress/2012/08/three-kinds-of-moocs/
Liyanagunawardena, T. R., Adams, A. A., & Williams, S. A. (2013). MOOCs: A systematic study of the published literature 2008-2012. The International Review of Research in Open and Distributed Learning, 1 4(3), 202-227. Retrieved from http://www.irrodl.org/index.php/irrodl/article/view/1455/2531
Marauri, P. (2014). Figura de los facilitadores en los Cursos Online Masivos y Abiertos (COMA/MOOC): nuevo rol profesional para los entornos educativos abiertos [The figure of the facilitators in the mass and open online courses (COMA/MOOC): new profesional role for open educational environmentes]. Revista Iberoamericana De Educación A Distancia, 17. (1), 35-67. doi: http://dx.doi.org/10.5944/ried.17.1.11573
Oliver, M., Hernández-Leo, D., Daza, V., Martín, C., & Albó, L. (2014). MOOCs en España. Panorama actual de los Cursos Masivos Abiertos en Línea en las universidades españolas [MOOCs in Spain. Current overview of the Open Massive Courses Online at Spanish universities]. Barcelona: Cátedra Telefónica Universitat Pompeu Fabra. Retrieved from http://www.catedratelefonica.upf.edu/wpcontent/uploads/2014/02/MOOCsenEspa%C3%B1a1.pdf
Reich, J. (2014, December 8). MOOC completion and retention in the context of student intent. EDUCAUSE Review. Retrieved from http://er.educause.edu/articles/2014/12/mooc-completion-and-retention-in-the-context-of-student-intent
Rodriguez, O. (2013). The concept of openness behind c and x-MOOCs (Massive Open Online Courses). Open Praxis, 5(1), 67-73. doi: http://dx.doi.org/10.5944/openpraxis.5.1.42
Schuwer, R., Gil-Jaurena, I., Aydin, C., Costello, E., Dalsgaard, C., Brown, M., … & Teixeira, A. (2015). Opportunities and threats of the MOOC movement for Higher education: The European perspective. The International Review of Research in Open and Distributed Learning, 16(6). doi: http://dx.doi.org/10.19173/irrodl.v16i6.2153
UNED (2016). Portal Estadístico Oficina de Tratamiento de la Información [Statistical Site of the Office of Information Processing]. Retrieved from https://app.uned.es/evacal/
Veletsianos, G., & Shepherdson, P. (2016). A systematic analysis and synthesis of the empirical MOOC literature published in 2013-2015. The International Review of Research in Open and Distributed Learning, 17(2). doi: http://dx.doi.org/10.19173/irrodl.v17i2.2448
Weller, M. (2014). The battle for open: How openness won and why it doesn't feel like victory. London: Ubiquity Press. doi: http://dx.doi.org/10.5334/bam
| Variable (reference category) | Sig. | Exp(B) |
| Gender (male) | .000 | 1.255 |
| Actividad (retired) | .000 | |
| Student | .000 | .661 |
| Employee | .266 | .923 |
| Self-employed | .982 | 1.002 |
| Unemployed | .000 | .715 |
| Studies (no studies) | .000 | |
| Basic /primary education | .373 | 1.968 |
| Secondary education | .157 | 2.895 |
| High school | .110 | 3.307 |
| Vocational training | .165 | 2.828 |
| University level | .059 | 4.113 |
| Postgraduate studies (master or doctorate) | .032 | 4.998 |
| Age | .001 | 1.005 |
| Constant | .002 | .100 |
| Component | ||||
| 1 | 2 | 3 | 4 | |
| The course met my previous expectations | .798 | -.218 | -.332 | .059 |
| The course contents were adequate and sufficient | .781 | -.193 | -.347 | .071 |
| The course methodology was motivating and appropriate | .799 | -.197 | -.250 | .096 |
| The course length was adequate | .658 | -.139 | -.157 | .140 |
| The course was well organised/structured | .809 | -.268 | -.253 | .058 |
| The virtual platform worked properly | .586 | -.279 | -.229 | .013 |
| Videos | .602 | -.319 | .288 | .197 |
| Complementary Material | .584 | -.098 | .448 | .260 |
| Tests, exams | .614 | -.200 | .503 | .255 |
| Self-assessments | .637 | -.217 | .435 | .230 |
| Peer-activities | .521 | .429 | .040 | .231 |
| Support from facilitator | .440 | .728 | -.142 | .372 |
| Support from tutor-curator | .444 | .722 | -.169 | .360 |
| Support from peers | .382 | .752 | -.085 | .298 |
| The following tolls are useful for learning and progress in the MOOC: · Videos | .736 | -.328 | .094 | -.058 |
| · Complementary Material | .757 | -.256 | .248 | -.064 |
| · Tests, exams | .744 | -.170 | .273 | -.150 |
| · Self-assessments | .777 | -.128 | .255 | -.166 |
| · Peer-activities | .645 | .421 | .148 | -.241 |
| · Support from facilitator | .654 | .540 | .146 | -.369 |
| · Support from tutor-curator | .660 | .539 | .138 | -.369 |
| · Support from peers | .564 | .606 | .156 | -.355 |
| I would recommend this course to other people interested in the topic | .830 | -.233 | -.279 | -.043 |
| Thanks to this MOOC I have known about UNED's educational offer (continuing education, official degrees, etc.) | .595 | -.003 | -.230 | -.046 |
| I would like to make more courses of this sort (MOOC) at UNED | .659 | -.267 | -.264 | -.184 |
| After this MOOC, I would like to make other courses at UNED (official studies, continuing education, etc.) | .528 | .037 | -.339 | -.194 |
*Note. Extraction method: principal component analysis
a. 4 extracted components.
| Component | Initial Eigenvalues | Extraction Sums of Squared Loadings | ||||
| Total | % variance | cumulative % | Total | % variance | cumulative % | |
| 1 | 11.237 | 43.220 | 43.220 | 11.237 | 43.220 | 43.220 |
| 2 | 3.764 | 14.477 | 57.698 | 3.764 | 14.477 | 57.698 |
| 3 | 1.829 | 7.035 | 64.733 | 1.829 | 7.035 | 64.733 |
| 4 | 1.265 | 4.864 | 69.597 | 1.265 | 4.864 | 69.597 |
| 5 | .959 | 3.689 | 73.286 | |||
| 6 | .812 | 3.123 | 76.409 | |||
| 7 | .682 | 2.625 | 79.033 | |||
| 8 | .667 | 2.564 | 81.597 | |||
| 9 | .597 | 2.296 | 83.894 | |||
| 10 | .559 | 2.151 | 86.044 | |||
| 11 | .503 | 1.936 | 87.980 | |||
| 12 | .474 | 1.823 | 89.803 | |||
| 13 | .378 | 1.455 | 91.258 | |||
| 14 | .334 | 1.285 | 92.543 | |||
| 15 | .291 | 1.119 | 93.662 | |||
| 16 | .271 | 1.041 | 94.703 | |||
| 17 | .231 | .887 | 95.590 | |||
| 18 | .209 | .805 | 96.395 | |||
| 19 | .199 | .766 | 97.161 | |||
| 20 | .167 | .641 | 97.802 | |||
| 21 | .149 | .574 | 98.376 | |||
| 22 | .128 | .492 | 98.868 | |||
| 23 | .112 | .432 | 99.299 | |||
| 24 | .099 | .381 | 99.681 | |||
| 25 | .054 | .208 | 99.889 | |||
| 26 | .029 | .111 | 100.000 | |||
*Note. Extraction method: principal component analysis.
![]()

Evaluation of the UNED MOOCs Implementation: Demographics, Learners' Opinions and Completion Rates by Inés Gil-Jaurena, Javier Callejo, and Yolanda Agudo is licensed under a Creative Commons Attribution 4.0 International License.