
Jia Frydenberg
University of California Irvine
USA
This study presents persistence and attrition data from two years of data collection. Over the eight quarters studied, the persistence rate in online courses was 79 percent. The persistence rate for similar onground courses was 84 percent. The drops for both course modalities were disaggregated by the time of the request for withdrawal: before course start, during the initial week, and during instruction. There was a significant difference between online and onground requests for withdrawals during the initial week. There was no significant difference between online and onground drop rates after the start of instruction, leading to the conclusion that differences in instruction online and onground was unlikely to be a major influencing factor in the student’s decision to drop.
Keywords: persistence; attrition; online; distance learning
The literature on student persistence has a long history. The outcome variable selected by the majority of the studies is the completion of a four-year or two-year formal degree, and the group whose behavior is studied is of traditional undergraduate age (18 – 22 years). The independent variables examined can be grouped into three broad and general categories (Tinto, 1993; Braxton, 2000; Tillman, 2002; Berge & Huang, 2004): variables attributable to the ‘individual persister/ non-persister,’ variables within the institution, and variables related to the interaction between the individual and the institution. A few examples of such variables are listed below.
Table 1. Commonly selected independent variables in persistence research

Dropout rates are of concern because, as reported in Berge and Huang (2004) and referencing Tinto’s (1982) work, “Historically, the percentage of students who dropout of brick and mortar higher education has held constant at between 40 – 45% for the past 100 years” (¶ 2).
The growing presence of adults on traditional campuses has led to an interest in research conducted to discover whether this group requires services with a different emphasis than do younger students. That they are different is not in question. Being older means they are more likely to have more external commitments, more financial resources, more likely to study part-time, more likely to have clearly defined goals, and a more acute ability to assess the perceived ‘return-on-investment’ they feel they are getting (or not getting) from their education (Bean & Metzner, 1985; Kember, 1989; MacKinnon-Slaney, 1994). Yet, while the groups of learners may be different, the same categories of independent variables (the person, the institution, and the interaction between the two) guide our research.
With the explosion of distance learning as an option for people seeking both degrees and continuing professional education, a concern has been raised regarding whether this modality, or loosely collected group of modalities, shows a different pattern of persistence and attrition than do onground educational modalities. The National Center for Education Statistics reported that for the academic year 2000-2001, over three million students were pursuing their postsecondary education through distance learning in the United States (NCES, 2003). However, given this relatively recent phenomenon and the need for longitudinal and rigorously controlled studies to assess whether students who take all (or most) of their undergraduate or graduate degree work at a distance show a higher attrition rate than the 45 percent cited above (Tinto 1982), it is understandable that the unit of analysis in most research on retention in distance education tends to be an individual course, not a complete degree program.
Dropout rates do appear to be significantly higher in distance education courses as compared to traditional, onground course equivalents (Parker, 1999; Diaz, 2000). In the Distance Education Report issue of April 15, 2002, Jennifer Lorenzetti (2002) asserts, “Dropout rates vary but can range as high as 50%” (p. 2). Individual characteristics and events in an individual’s life have been predicted to influence persistence in distance learning programs (Powell, Conway, & Ross, 1990; Tennant & Pogson, 1995). Nonetheless, Kemp (2002) did not find significant correlations between life events and attrition in her study of a first-year degree course at Athabasca University. Perhaps unsurprisingly, prior academic success does appear to be predictive of persistence (Morris, Wu, & Finnegan, 2005; Dupin-Bryant, 2004) in online as well as in onground classes.
Changes in institutional support systems have been proposed to enhance persistence in academic course completion among adult learners at a distance as a result of analysis of individual characteristics (MacKinnon-Slaney, 1994; Castles, 2004). The authors of both these studies agree that more in-depth orientation to the educational program and ongoing proactive counseling would be desirable, and they predict that these could stem some of the dropout from distance education courses.
An important group of persistence theories and studies are those focusing on the quality of interaction between representatives of the institution and the students (Astin, 1971; Tinto, 1982). Faculty involvement appears to be crucial in student satisfaction, and satisfaction seems to be predictive of persistence (Astin, 1977; Pascarella, Terenzini, & Wolfe, 1986). Of great interest to the field, would be studies comparing faculty involvement and instruction in reasonably comparable onground and online classes or, better yet, in complete degree programs.
The present study describes persistence data collected over two years. Since the University of California Irvine divides the academic year into four quarters, this time frame covers the quarters, Spring 2004 through Winter 2006. The group studied is comprised of adults pursuing continuing professional education through University Extension. The unit of analysis is the individual course. Class sizes tend to be between 10 and 25 students. The independent variable falls under the category ‘the institution,’ and examines the point in time when a student drops the course.
It is a comparative study, gathering data from online and onground continuing professional education classes offered by UC Irvine Extension. The onground class sections are offered primarily in the evening as once-a-week, three-hour long meetings. A standard Extension class has 10 meetings of three hours and offers three continuing education credits for successful (evaluated) completion of the course objectives. The online classes also have fixed start- and end-dates, and run the equivalent length of time (10 weeks), plus an extra week called ‘Orientation Week,’ which is described below. All classes are evaluated and graded with assignments tied to preset due dates, and a substantial percentage of the grade is based on participation in the online threaded discussions. Both the online and onground course sections are instructor-facilitated.
One of the reasons for the scarcity of aggregable data from multiple university providers of online as well as onground learning may be a lack of consistency in defining attrition. As a result, we may be, as researchers at Brigham Young University propose, comparing ‘apples and oranges’ when we put onground and online programs side by side. In the unpublished article “Reevaluating Course Completion in Distance Education,” Howell, Laws, and Lindsay (2004) note that, “At . . . Brigham Young University nonstarters in traditional courses are not considered dropouts although they are considered dropouts for distance education courses” (p. 9).
Ormond Simpson expands this list of possible definitions of what ‘dropout’ might mean in his book “Supporting Students in Online, Open, and Distance Learning” (Simpson, 2002). He notes the following nine stages at which a student could potentially be considered a dropout (p. 168):
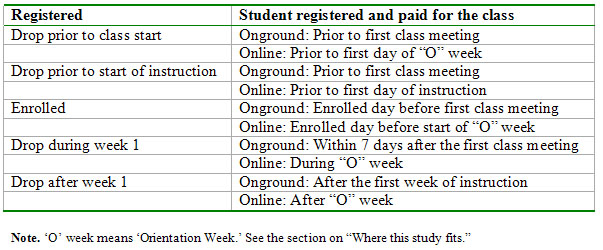
In the present study, we have collapsed these categories into 4 stages. Although ‘dormant’ students (we call them ‘MIA’s’) and students who stay on-task almost to the end and then fail in one way or another is an interesting issue to examine, they are not included in the present study2. In this investigation, we include only ‘active drops.’ Our time definitions are listed in Table 2.
Table 2. Definitions of dropout at different stages
While growing rapidly, the online program at UC Irvine Extension still only served 366 out of the total 3,037 enrollments in the last quarter of data included in this study: Winter 2006 (12%). Over the two years, the percentage is naturally even smaller: 1,847 / 27,815 (6.6%). Table 3 compares total registrations with total active drops in onground and online course sections.
Table 3: Total course registrations minus total drops

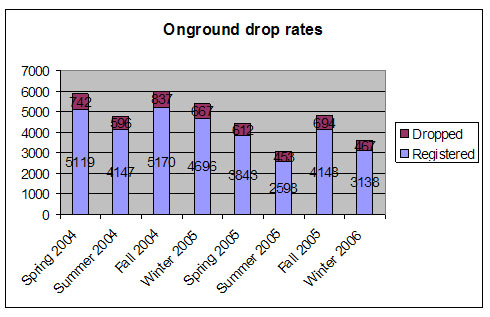
While there is some variation quarter over quarter, the persistence rates remain reasonably steady, both in the online and the onground program. Figures 1 and 2 show this consistency.
Figure 1. Drop pattern in online courses by quarter
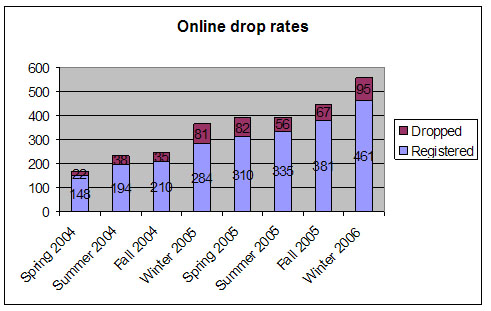
Figure 2. Drop pattern in onground courses by quarter
However, there is a marked difference in the percentage attrition between the large onground program (15%) and the smaller online program (21%). Table 4 shows that this difference is statistically significant.
Table 4: Comparison of online and onground persistence rates

As described above, the onground students meet the educational facility (campus), the course content (syllabus and handouts), and the instructor at the same time at the initial class meeting. The online students, however, meet these potentially influencing factors gradually. During ‘O’ week, the facility (the virtual classroom) and all the content (syllabus, lessons, and assignments) are available for students to peruse. They meet the instructor the following week. Table 5 below shows the distribution of drops grouped by the time of dropping the course.
Table 5. Drop rates before class start, during first week / ‘O’ week, and after instructional start
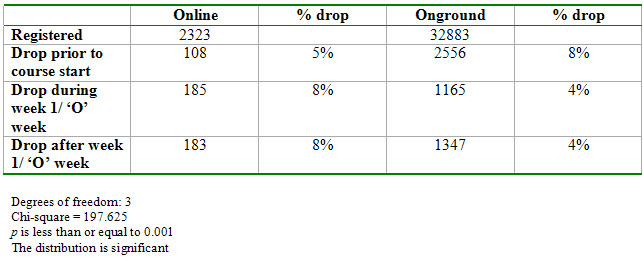
More onground than online students dropout prior to having met either the classroom, the course content, or the instruction/ instructor; however, the focus of this investigation is on the first week and subsequent weeks of the course.
To examine whether drop rates differed after instruction had begun (and after the students had ‘met’ either virtually or in person with the instructor), we collapsed the data from Table 5 by combining the 108 online drops prior to course start with the 185 online students who dropped during the ‘O week.’ These students all dropped before instruction had begun. For the onground students, the picture is reversed: those who dropped during week one were combined with those who dropped later in the quarter, because all of these students had then been exposed to instruction. As per Table 2 above, ‘Drop during week 1’ was defined as ‘Drop during the 7 days after course start’ in order to capture the same time frame as the seven days of the week of the online course orientation week. Table 6 shows this new distribution.
Table 6. Drop rates before and after start of instruction

By aggregating the data this way, an interesting pattern emerges. The percentage of people dropping out of classes after instruction has begun is essentially the same in online and onground classes. Recall from Table 5 above that in the online classes, only 5 percent dropout prior to having experienced any aspect of the course. However, given the 8 percent of online students who drop during ‘Orientation Week,’ this boosts the dropout rate to 13 percent prior to the start of instruction. We propose that it is probably not the instruction in the online classes that is the root cause of the higher dropout rate.
This leaves us with the question of whether students’ motivation to drop a course is related to the online content, to the technology, or, simply, to life interfering with their plans.
Adult students participating in continuing professional education are naturally surrounded by a different set of life pressures than college undergraduates. Whether life circumstances, such as workload pressures, are predictive of lack of persistence in educational endeavors is unclear in the literature. Tennant and Pogson (1995) found evidence to suggest that life circumstances and transitions was predictive, but Kemp (2002) reports that “For the most part, external commitments – in the form of personal, family, home, financial, and community commitments – were not found to be significant predictors of persistence (or lack of persistence) in distance education” (p. 75).
As part of a larger effort for us to understand better why students who have registered for a class choose to drop, the UCI Extension student services office assigns each request for withdrawal a code to describe the reason for the drop. Withdrawal requests are accepted only in writing: by fax, email, or in person. There is no form to check off and giving a reason is voluntary, so the student services staff does a textual analysis of the request to assign it a drop code.
Table 7. Reasons given for requesting withdrawal from online courses
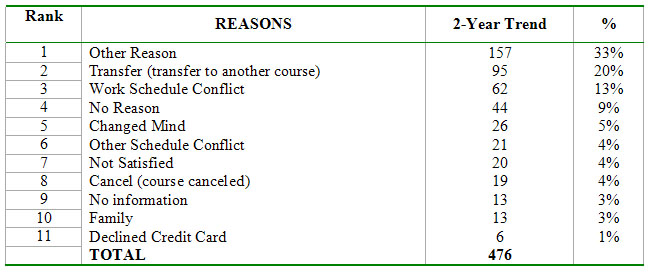
If we combine reasons 1 and 4 above, which essentially means that the person requesting withdrawal either was not willing to give their reason or that none of the categories fit their reason, we get a total of 201. Unfortunately, this comprises almost 50 percent of our data. We can also reasonably combine ‘Work Schedule Conflict’ and ‘Other Schedule Conflict,’ resulting in a total of 83 people selecting this category. The ‘Transfer’ category may be transfer to another online course, it may be transfer to an onground course, or it may even be transferring from one quarter to another. That detail of data is not captured. Figure 3 details the top six categories, which account for 93 percent of the data.
Figure 3. Distribution of drop reasons in online courses (top 6 reasons)
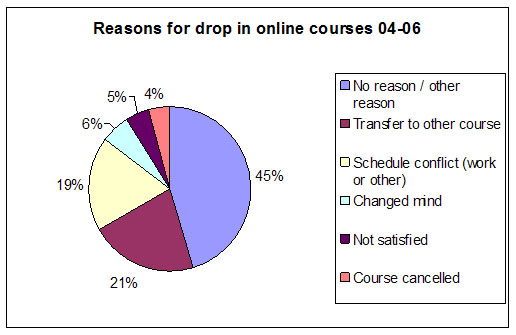
‘Not Satisfied’ accounts for 5 percent of this reduced data set. It does not appear that an expressed lack of satisfaction with the technology, with the instruction, or with the content of the online classes is the primary reason for dropping out. From the two-year data set above, one could draw the conclusion that ‘life interfered.’
Table 8. Top three reasons for withdrawal from online classes, accounting for 85 percent of the data

Comparable data exist for onground classes. For the same two-year period (Spring 2004 through Winter 2006):
Table 9. Reasons given for requesting withdrawal from onground courses
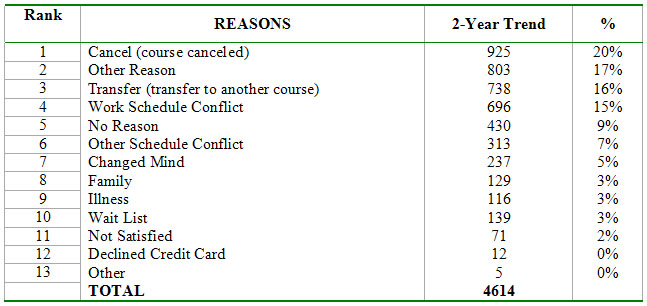
Collapsing the top categories as was carried out for the online courses, we get:
Figure 4. Distribution of drop reasons in onground courses (top 9 reasons)

Table 10. Top four reasons for withdrawal from onground classes, accounting for 85 percent of the data

Side by side, the data appear this way:
Figure 5a, 5b. Comparing the reasons people give for withdrawal
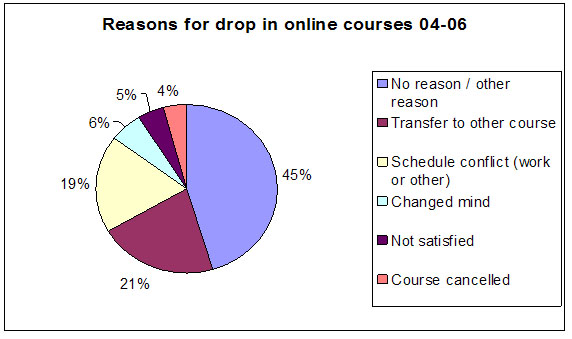
Figure 5a.
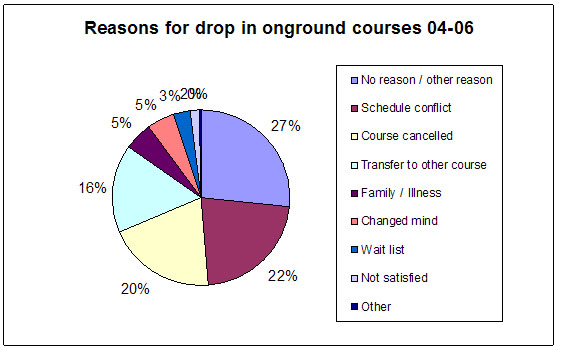
Figure 5b.
While different, there is a striking similarity. ‘No/ Other Reason,’ ‘Transfer’ to another course, and ‘Schedule Conflict’ lead both lists, accounting for 85 percent of the online courses and 65 percent of the onground courses. The large difference in the category ‘Course Cancelled’ between the two modalities is that we allow online courses to run with a much smaller class size than the onground courses and hence they are rarely cancelled. There is a difference in the category ‘Not Satisfied,’ – four percent (n = 20) students in online classes, and two percent (n = 71) students in the onground classes – but this is insufficient data from which to draw conclusions.
When the unit of analysis is the individual course, we do not see the 45 percent dropout rate mentioned in Tinto (1982). The total drop rate in this two-year study, before instruction as well as after course start, is 21 percent in online classes and 16 percent in onground classes. In other words, 79 percent of online students and 84 percent of onground students in this study of adults pursuing continuing professional education did not actively withdraw from their courses.
Second, there is no striking difference in attrition after instruction has begun; in fact, there is no difference at all. This is interesting (and, I admit, surprising) because it would seem to be ‘common sense’ to hypothesize that the relationship between an unseen instructor (online classes) and one you can get physically close to (onground classes) would be likely to be associated with a different level of satisfaction with the education received. And satisfaction, as we saw in the introduction, has been shown to correlate with persistence. Perhaps the fact that we require online instructors to be actively participating in class asynchronous discussions online every 48 to 72 hours (depending on the course type) mitigates the lack of ‘eyeball-to-eyeball’ interaction?
Third, student self-reports in giving a reason for requesting withdrawal from a class are largely similar. From that kind of evidence, we would draw the conclusion that it is life (‘No Reason’ and ‘Schedule Conflict’) that primarily interferes with the intent to complete a course. However, the large percentage of ‘Transfer’ among the online students does need to be investigated. Which courses did they transfer to? That is, did they transfer to another online course or from online to onground?
Fourth, something is going on during the ‘Orientation Week’ of the online classes. The attrition rate during that time period is twice that of onground classes. This enables us to focus our research. If we assume that life events occur equally at any period of the run of a course, the three remaining possibilities are that it could be something about the online course platform (or its very existence) as a virtual classroom, it could be the quality or amount of the online class content which substitutes for the content delivered by a live instructor, or it could be an issue of a student’s expectations. Given that none of the participants in today’s adult continuing education could possibly have formed expectations of the social and interactional structure of an online virtual class in their years of formal schooling, they may have unstated expectations of the online class that are different from what they meet. There is, after all, double the percentage of ‘Not Satisfied’ students requesting withdrawal in online versus onground classes. These blueprints for hypotheses will guide our future research at the University of California Irvine Distance Learning Center.
Finally, in order to be able to conduct cross-institutional studies and aggregate data in meaningful ways, we hope that the definitions of the time a student withdraws prove useful for other researchers.
The author wishes to express her appreciation of the efforts of the University of California Irvine Extension Student Services staff in collecting the data that form the basis of this study.
1. A ‘re-sit’ is a person who is allowed to retake an exam
2. We do, however, have data on these students going back four quarters, and the issues of ‘flunk-out’ in one way or another will be the subject of another article.
Astin, A. 1971. Predicting academic performance in college. New York: Free Press.
Astin, A. 1977. Four Critical Years: Effects of college on beliefs, attitudes, and knowledge. San Francisco: Jossey-Bass.
Bean, J., & Metzner, B. (1985). A conceptual model of non-traditional undergraduate student attrition. Review of Educational Research, 55(4), 485-540.
Berge, Z., & Huang, Y. (2004, May). A Model for Sustainable Student Retention: A holistic perspective on the student dropout problem with special attention to e-learning. DEOSNEWS, 13(5). Retrieved October 21, 2007, from: http://www.ed.psu.edu/acsde/deos/deosnews/deosnews13_5.pdf
Braxton, J. (2000). Reworking the student departure puzzle. Nashville, TN.: Vanderbilt University Press.
Castles, J. (2004). Persistence and the adult learner. Active Learning in Higher Education, 5(2), 166-179.
Diaz, D. (2002, May/ June). Commentary: Online drop rates revisited. The Technology Source. Retrieved October 23, 2007 from: http://technologysource.org/article/online_drop_rates_revisited/.
Dupin-Bryant, P. A. (2004). Pre-entry variables related to retention in online distance education. The American Journal of Distance Education, 18(4), 199-206.
Howell, S. L., Laws, R. D., & Lindsay, N. K. (2004). Reevaluating Course Completion in Distance Education: Avoiding the comparison between apples and oranges. Unpublished handout at the University Continuing Education Association (UCEA) Conference, April 16, 2004. San Antonio Texas.
Kember, D. (1989). A longitudinal-process model of drop-out from distance education. The Journal of Higher Education , 60(3), 278-301.
Kemp, W. (2002). Persistence of adult learners in distance education. The American Journal of Distance Education, 16(2), 65-81.
Lorenzetti, J. (2002). Before They Drift Away: Two experts pool retention highlights. Distance Education Report, 6(8), 1-2.
MacKinnon-Slaney, F. (1994). The Adult Persistence in Learning Model: A road map to counseling services for adult learners. Journal of Counseling and Development , 72(3), 268-275.
Morris, L., Wu, S., & Finnegan, C. (2005). Predicting retention in online general education courses. The American Journal of Distance Education, 19(1), 23-36.
NCES (2003). National Center for Education Statistics website. Retrieved October 23, 2007 from: http://nces.ed.gov/surveys/peqis/publications/2003017/
Parker, A. (1999). A study of variables that predict dropout from distance education. International Journal of Educational Technology, 1(2). Retrieved October 23, 2007 from: http://smi.curtin.edu.au/ijet/v1n2/parker/index.html
Pascarella, E., Terenzini, P., & Wolfe, L. (1986). Orientation to college and freshman persistence/ withdrawal decisions. Journal of Higher Education, 57(2), 155-175.
Powell, R., Conway, J., & Ross. L. (1990). Effects of student predisposing characteristics on student success. Journal of Distance Education, 5(1). Retrieved October 23, 2007 from: http://cade.icaap.org/vol5.1/8_powell_et_al.html
Simpson, O. (2002). Supporting students in online, open, and distance learning. London: Kogan Page.
Tennant, M., & Pogson, P. (1995). Learning and Change in the Adult Years: A developmental perspective. San Francisco: Jossey-Bass.
Tillman, C.A. Sr. (2002). Barriers to student persistence in higher education. Retrieved October 3, 2002 from: http://www.nazarene.org/ed_didache/vol2_1.html
Tinto, V. (1982). Limits of theory and practice in student attrition. Journal of Higher Education, 53(6), 687-700.
Tinto, V. (1993). Leaving College: Rethinking the causes and cures of student attrition (2nd edition). Chicago: University of Chicago Press.