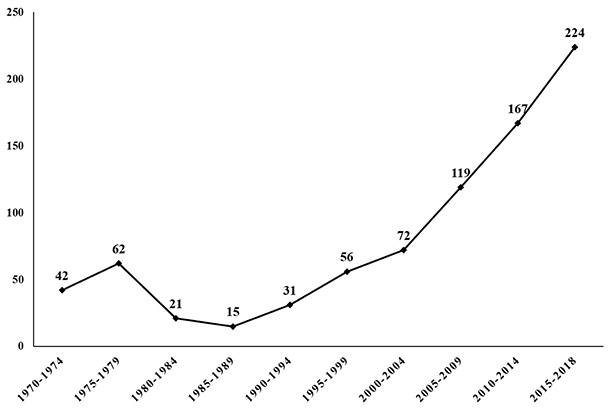
Figure 1. Diachronic output on OUs organized in periods of five years.
Volume 20, Number 4
Francisco-Javier Hinojo-Lucena, Inmaculada Aznar-Díaz, María-Pilar Cáceres-Reche, and José-María Romero-Rodríguez
University of Granada, Spain
Since open universities can adapt to students' work schedules, personal preferences, age, and so on, they have facilitated access to education for a large group of people. The open university phenomenon, which arose in the 1960s, fostered countries' cultural growth; higher education was now longer exclusively for a privileged few. This paper presents a bibliometric study on the existing scientific output on open universities throughout the last 40 years. A bespoke methodology of bibliometric studies has been used, by setting key descriptors to be consulted in the most prestigious scientific database Web of Science. The sample was composed of 809 papers in total, indexed in prestigious journals and published during the period 1969 to 2018. The output, scattering, and impact bibliometric indicators were analysed in those papers. Among the results obtained, it was found that scientific output on open universities is in a phase of exponential growth, in which 2015 was the most productive year. Furthermore, the UK, where the phenomenon of open universities started, is the country with the most scientific output. Finally, the bibliometric study of the output indexed in the Web of Science shows a panoramic vision of the past, present, and future of open universities, emphasising the idea that this phenomenon is continuing to grow.
Keywords: open universities, higher education, bibliometric analysis, scientific output
Since they were established, open universities (OUs) have provided their own type of education, with the aim of bringing higher studies closer to everyone. The main change they promoted was to offer distance studies that could be adapted to the learning process of each student (Open University of Catalonia, 1998). This is one of the premises of open universities - the possibility of providing education within everybody's grasp, regardless of their location, age, or socioeconomic background (Lim, Fadzil, & Mansor, 2011). The OUs are defined as “institutions which provide open admission to adult students and, through flexible policies and a variety of delivery mechanisms, notably distance education, provide access to and success in university education to those previously denied such opportunity” (Paul, 1993, pp. 115-116).
This higher education revolution began in the United Kingdom, where The Open University UK was founded in 1969. In its more than 40 years of existence, it has developed distance studies extensively by using its own learning approach based on learning design (LD), defined as a methodology focused on teachers' ability to improve the design of learning activities and the effective use of technological resources (Rienties et al., 2016). The key point is to provide the student with materials that aid their learning (Rienties, Nguyen, Holmes, & Reedy, 2017).
The phenomenon of OUs is global, as many of its implications have worldwide appeal, including: (a) flexible schedules in order to be able to combine studies with work and family, (b) eradication of geographical barriers, (c) lower costs for students, and (d) the possibility of access to education for vulnerable groups (Inouye, Souza, Lost, & Silva, 2018; Lima, Maia, Veras, Delgado, & Moreira, 2003; Tait, 2013). These factors have had an impact on the spread of OUs across different countries, 11 of which are the largest distance learning institutions (Tait, 2013): (a) Allama Iqbal Open University (AIOU; Pakistan); (b) Athabasca University (AU; Canada); (c) Indira Gandhi National Open University (IGNOU; India); (d) National Open University of Nigeria (NOUN); (e) The Open University UK (OU); (f) The Open University of China (OUC); (g) Open University of Malaysia (OUM); (h) The Open University of Tanzania (OUT); (i) Wawasan Open University (WOU; Malaysia); (j) National Distance Education University (UNED; Spain); and (k) University of South Africa (UNISA). These universities represent a large number of countries from all corners of the planet.
It is important to differentiate between OUs and distance education. An OU is an institution dedicated to adult education, with adapted curricula, free knowledge, and innovative methodology, whereas online or distance training is a training modality that does not require attendance and is adapted to the students' specific characteristics and needs (Inouye et al., 2018). Furthermore, distance education does not require face-to-face interaction; OUs may use distance education as part of the teaching methodology as well as it can be used as a training resource at the OU (Paul, 1993).
The success of OUs goes back to the first comparative research with regular universities, whose results revealed that the need for both self- and externally regulated learning was similar in both types of higher education (Vermunt, 1998). As stated in subsequent research (Cabrera & Fernández-Ferrer, 2017), teachers in OUs show a certain sensitivity to applying functions based on feedback from students, thus achieving greater engagement. In addition, since their beginnings, these universities have been consolidating as one of the modalities par excellence among adults over 50 years of age (Klimczak & Kossakowska, 2018).
OUs have been transformed by the emergence of information and communication technologies (ICT). Adopting e-learning has equipped OUs with more resources for learning and has enabled them to increase their target audience (Olatunji, Afolake, & Kehinde, 2017; Salmon, 2000). Therefore, their ample presence on the World Wide Web as well as their open educational resources help students learn about how OUs work and what training programmes they offer (Daga, d'Aquin, Adamou, & Brown, 2016).
Over recent decades, virtual campuses have become the main space for accessing learning content, and also as a meeting point for students and teachers (Caballe & Xhafa, 2013). This system implemented by OUs has enabled their exponential growth, by facilitating ubiquitous access to information.
Among the current new challenges for OUs are the constant updating and implementation of technologies that improve the learning process for students. For example, where emerging mobile technologies begin to be introduced, mobile learning approaches soon follow (Rangel & Pereira, 2016).
Given that OUs have existed for half a century, and taking into account the huge changes they've brought to the access to and democratization of university learning, analysing the literature published over those years is of scientific interest. In order to give a sense of continuity to the subject, this research followed the line of other bibliometric studies in the field of open and distance learning.
The first (Avello-Martínez & Anderson, 2015) focused on classifying the papers published by The International Review of Research in Open and Distributed Learning (IRRODL) since its origin in the year 2000, and on the general and particular impact of the highly cited papers. The second (Zawacki-Richter & Naidu, 2016) focused on trends in distance education research in the journal Distance Education during the period of 1980 to 2014. It highlighted general topics that have prevailed in a series of five-year periods.
However, unlike these specialised works in specific journals, this paper reviewed the historical journey of OUs through bibliographic analysis of published papers in journals indexed in the Web of Science database. The purpose of this study is to increase readers' knowledge of the OU phenomenon and its current state of development through the analysis of different bibliometric indicators. The justification for and significance of this analysis are based on the four research questions that guide the work:
Bibliometric studies consist of the analysis of metadata from scientific literature to determine the current state of a specific topic (Glanzel & Schoepflin, 1999). Considering the social impact and the educational revolution caused by the OUs for more than 40 years, this paper was designed to analyse the scientific output on open universities from their origins in 1969 to 2018.
Following the consideration of previous bibliometric studies (Cristino, Neto, & Costa, 2018; Glanzel, 2002; Gómez-García, Ramiro, Ariza, & Reina, 2012; Gutiérrez, Martín, Casasempere, & Fernández, 2015; Juliani & de Oliveira, 2016), bibliometric indicators related to the output, scattering, and impact of the literature released on OUs were analysed. More specifically, output indicators show the diachronic productivity and the authors' productivity based on the verification of Price's (Price, 1986) and Lotka's (Rousseau, & Rousseau, 2000) bibliometric laws. Scattering indicators show journal distributions regarding the number of documents; to this end, Bradford's law indicates the uniform distribution of papers within different areas (Urbizagastegui, 2016). Finally, impact indicators specify the influence that some journals, institutions, authors, and countries have had concerning the scientific output on this topic. Impact factors were measured through the number of documents and quotes (Gutiérrez et al., 2015).
The study focused on the Web of Science database (WOS), since it is the most prestigious one among social sciences given its own impact factor, namely the Journal Citation Reports (JCR) (Hernández, Reverter, Jové, & Mayolas, 2013). The unit of analysis comprised papers from journals indexed in WOS up to the third semester of 2018 (N = 809). With the aim of covering a greater breadth of documents on OUs, the search term “Open Universities” OR “Open University” was set up. This term was entered into the search engine, selecting the category of topic in order not to limit initial results. Subsequently, a number of inclusion and exclusion criteria for refining scientific literature were applied (Table 1).
Table 1
Inclusion and Exclusion Criteria Used in the Bibliometric Study
| Inclusion criteria | Exclusion criteria |
| The main topic involves experiences, research or theoretical studies on open universities Journal article | Open universities are not the main theme of the paper Proceedings paper, book review, book chapter, editorial material, book |
Two methodological limitations of the bibliometric study are highlighted. The first is related to data collection in 2018, given that at the time of search the year had not ended; thus, there is a possibility that scientific production may vary by the end of the year. The second limitation is typical of bibliometric studies in databases and is linked to the search engine. In this sense, those articles that do not include the descriptor “Open Universities” or “Open University” in the title, summary, or keywords may be excluded from the final results.
The results obtained in each indicator analysed reveal the current situation of scientific literature on OUs. The following section presents data based on each of the different bibliometric indicators. Some data have been analysed using the statistical programme SPSS (version 24).
Diachronic productivity (Figure 1) shows the beginning of scientific output in 1970, a year after the first OU started. 1987 is the year with the least output, with 0 documents, while in 2015 literature peaks at 82 papers (10.13%). Furthermore, it is observed that during the 1970s, there were more publications on OUs than in the 1980s and 1990s, showing a drop in scientific output during the years following the beginning of this type of universities. The upturn in literature takes place in 2000, and it has kept growing since then.
In order to verify Price's law, the scientific output has been classified in periods of five years (Gutiérrez et al., 2015); the main premise of this law is that literature tends to duplicate after 10 years. In this case, this assumption was not met for the first decades, given that there was more literature in the 1970s than in the 1980s and 1990s. On the contrary, from 1990 (31 documents; 3.83%) to 2000 (72 documents; 8.89%), and from 2000 to 2010 (167 documents; 20.64%) the duplication explained by Price (1986) was indeed produced. Likewise, Price divides scientific output into three different phases: (a) precursor phase, (b) exponential growth phase, and (c) linear growth phase. Each one defines a period in the literature by making reference to its origins, development, and consolidation. The output on OUs classified in years shows a precursor phase during 1970 to 1989. It is currently in an exponential growth phase that began in 1990, during which output remains at full peak level.
Figure 1. Diachronic output on OUs organized in periods of five years.
Author productivity shows the relationship between the number of authors and papers (Table 2). Lotka's law indicates that most papers come from a few authors who are considered to be very productive (Rousseau & Rousseau, 2000). This is reflected in literature on OUs, in which a large proportion of the papers are written by just one author. Thus, we have an output of 44 papers by one author (5.43%), while 560 authors only submitted one paper (.12%). This happens successively, wherein a large number of documents are produced by a few authors. In this regard, following the guidelines suggested by González, Moya, and Mateos (1997) the scientific literature on OUs is underpinned by 560 authors who are considered lesser producers (< = 1 paper; 60.75%), 355 authors who are medium producers (> 1 < = 9 papers; 38.50%), and 7 authors classified as super-producers (> = 10 papers;.75%).
Table 2
Relationship Between Authors and Papers in Literature on OUs
| Authors | Number of papers |
| 560 | 1 |
| 183 | 2 |
| 144 | 3 |
| 16 | 4 |
| 8 | 5 |
| 2 | 6 |
| 3 | 7 |
| 1 | 8 |
| 1 | 9 |
| 1 | 11 |
| 1 | 12 |
| 1 | 14 |
| 1 | 21 |
| 1 | 29 |
| 1 | 42 |
| 1 | 44 |
The data support Lotka's law. Their graphic expression shows the negative correlation between the number of authors and papers (r = -.37; y = 14,647e-.091x; see Figure 2). Therefore, fewer authors are concentrated among a greater number of articles. Although the model has a low calibration (R2 =.31), the relationship between the variables properly reflects the bibliometric indicator of the authors' productivity.
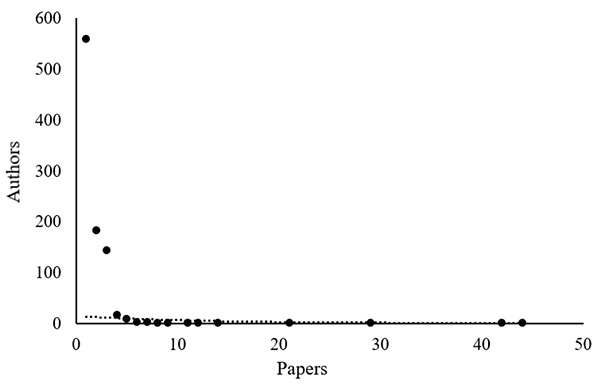
Figure 2. Correlation between authors (Y axis) and papers (X axis).
Scattering in scientific output on OUs is determined by the distribution of journals according to the number of documents. Bradford's bibliometric law was applied, and it showed an equal distribution of papers by zones, highlighting that the centre had a number of documents equivalent to the remaining zones, despite having fewer journals (Urbizagastegui, 2016). Something similar occurs with Lotka's law - most of the papers were concentrated in a small group of journals.
By implementing Bradford's law, four zones were obtained, with approximately 200 papers each (see Figure 2). The total amounts to 407 journals and 809 papers. In particular, the centre comprises 193 papers (23.85%) and 10 journals (2.45%); zone 1 has 201 papers (24.85%) and 48 journals (11.80%); zone 2 has 205 papers (25.35%) and 139 journals (34.15%); and zone 3 has 210 papers (25.95%) and 210 journals (51.60%). Therefore, the scattering of literature is verified, since the centre involving 10 journals contains a similar number of documents to the remaining zones, which have a larger number of journals.
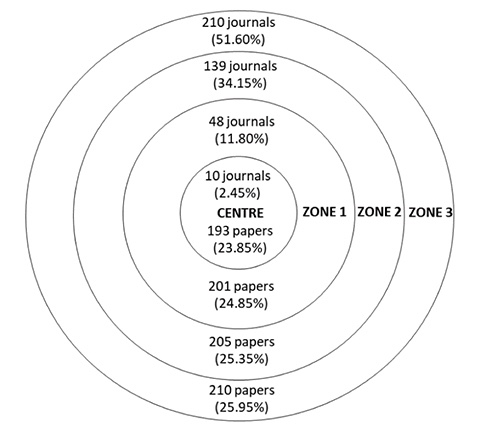
Figure 3. Bradford's scattering zones of scientific journals on OUs.
It is possible to find the significance in the correlation between the number of journals and papers in an analysis of linear regression, this relationship being negative (r = -.34; y = 12,329e-0,088x). See Figure 4. Besides, the model reveals a good calibration (R2 =.36), explaining 36% the variability of the Y axis in proportion to its average. In other words, the fewer the journals, the trend is a greater number of documents.
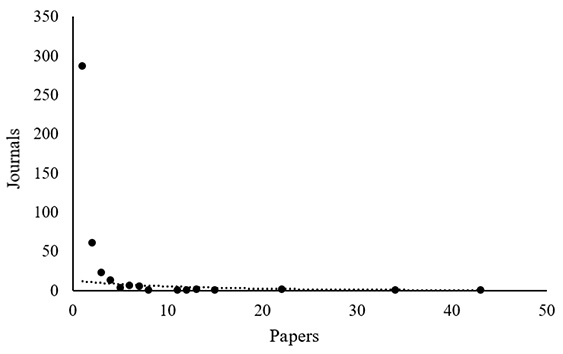
Figure 4. Analysis of linear regression between the number of journals (Y axis) and papers (X axis).
Over the years, contributions to the OU literature have come from a variety of journals, institutions, countries, and authors. These points of reference are prominent given the number of documents published as well as the scientific impact thereof. The journals analysed in this study comprise the centre of Bradford's scattering zone (n = 10). Most of these journals are characterised by having major editors, such as the groups represented by Wiley, Elsevier, Springer, and Taylor & Francis. Only 2 of these 10 journals are managed by small editors, namely Athabasca University Press and International Council for Open and Distance Education (ICDE). See Table 3.
Table 3
Journals With the Most Output on OUs
| Journal | Papers | % | Citations | II | Editors |
| British Journal of Educational Technology | 43 | 5.31 | 406 | 9.44 | Wiley |
| International Review of Research in Open and Distributed Learning | 34 | 4.20 | 231 | 6.79 | Athabasca University Press |
| Computers & Education | 22 | 2.71 | 480 | 21.81 | Elsevier |
| Higher Education | 22 | 2.71 | 274 | 12.45 | Springer |
| Studies in Higher Education | 15 | 1.85 | 301 | 20.06 | Taylor & Francis |
| Systemic Practice and Action Research | 13 | 1.60 | 53 | 4.07 | Springer |
| Open Learning | 13 | 1.60 | 22 | 1.69 | Taylor & Francis |
| Distance Education | 12 | 1.48 | 69 | 5.75 | Taylor & Francis |
| Open Praxis | 11 | 1.35 | 11 | 1 | ICDE |
| Religion | 8 | .98 | 4 | .5 | Taylor & Francis |
Note. II = impact index. Calculation of the impact index = citations/papers.
Most of the referring institutions on this topic are themselves OUs. Those considered super-producers (> = 10 papers) were analysed. The Open University UK stands out by far over the other universities, exceeding the second most productive one by six times (Table 4).
Table 4
Organizations With the Most Output on OUs
| Organization | Papers | % | Citations | II |
| The Open University UK | 287 | 35.47 | 2,713 | 9.45 |
| Sukhothai Thammathirat Open University | 45 | 5.56 | 393 | 8.73 |
| Australian National University | 44 | 5.43 | 421 | 9.56 |
| University of London | 22 | 2.71 | 89 | 4.04 |
| Open University of the Netherlands | 19 | 2.34 | 176 | 9.26 |
| Monash University | 16 | 1.97 | 139 | 8.68 |
| Hellenic Open University | 15 | 1.85 | 204 | 13.16 |
| Open University of Catalonia | 15 | 1.85 | 111 | 7.4 |
| University of Queensland | 11 | 1.35 | 216 | 19.63 |
Note. II = impact index. Calculation of the impact index = citations/papers.
The most productive countries are the super-producers (n = 13). England is the country with a much higher number of papers compared to the others, with a total of 365 documents, which represents 45.11% of general output - this means almost half of all literature on OUs. England also represents a huge number of citations, namely 3,552and an impact factor of 9.73 points (see Table 5).
Table 5
Countries With the Most Output on OUs
| Country | Papers | % | Citations | II |
| England | 365 | 45.11 | 3,552 | 9.73 |
| Australia | 64 | 7.91 | 583 | 9.10 |
| Thailand | 49 | 6.05 | 400 | 8.16 |
| Brazil | 47 | 5.80 | 359 | 7.63 |
| Spain | 47 | 5.80 | 318 | 6.76 |
| USA | 42 | 5.19 | 213 | 5.07 |
| Netherlands | 25 | 3.09 | 501 | 20.04 |
| India | 23 | 2.84 | 32 | 1.39 |
| Greece | 22 | 2.71 | 250 | 11.36 |
| Scotland | 21 | 2.59 | 236 | 11.23 |
| China | 17 | 2.10 | 147 | 8.64 |
| Canada | 16 | 1.97 | 102 | 6.37 |
| Israel | 15 | 1.85 | 166 | 11.06 |
Note. II = impact index. Calculation of the impact index = citations/papers.
There are 7 authors considered to be super-producers, contributing a total of 173 papers (21.83% of total output). Furthermore, 6 of these belong to the same institution (the Australian National University), having submitted papers with joint authoring. The other author is affiliated with The Open University UK (see Table 6).
Table 6
Authors With the Most Output on OUs
| Author | Papers | % | Citations | II | Organization |
| Sleigh, A. | 44 | 5.43 | 421 | 9.56 | Australian National University |
| Seubsman, S. A. | 42 | 5.19 | 379 | 9.02 | Australian National University |
| Yiengprugsawan, V. | 29 | 3.58 | 198 | 6.82 | Australian National University |
| Richardson, J. T. E. | 21 | 2.59 | 281 | 13.38 | The Open University UK |
| Bain, C. | 14 | 1.73 | 213 | 15.21 | Australian National University |
| Banwell, C. | 12 | 1.48 | 98 | 8.16 | Australian National University |
| Kelly, M. | 11 | 1.35 | 83 | 7.54 | Australian National University |
Note. II = impact index. Calculation of the impact index = citations/papers.
The bibliometric study carried out followed the approach taken by previous works that analysed a certain topic based on bibliometric indicators (Cristino et al., 2018; Glanzel, 2002; Gómez-García et al., 2012; Gutiérrez et al., 2015; Juliani & de Oliveira, 2016). Therefore, this paper was prepared on the basis of these studies, and analysed the metadata of the literature published on open universities, and considered the bibliometric indicators of output, scattering, and productivity.
The changes to higher education brought about by the OUs are fully reflected in the literature, where we can see the large number of documents generated on the topic over recent years. The number of documents has increased through the implementation of ICT at OUs (Caballe & Xhafa, 2013; Olatunji et al., 2017; Salmon, 2000); many of institutions have turned into references in terms of implementing educational technologies and virtual learning, as is the case for The Open University UK (Daga et al., 2016). In this respect, the impetus given throughout those years to apply ICT in education may be a variable that explains the surge in scientific output.
It is remarkable how literature dropped in the 1980s after its beginnings in the 1970s, which suggested there would be an increase in output in the following years. The events that the UK experienced in the 1980s with the Falklands War and the fall of the Berlin Wall could have had a negative impact on the interest in OUs at that time.
On the other hand, there was a concentration of a large amount of output by the same authors and journals, by which they became established as authorities in this field. Some authors, such as Sleigh, A. and Seubsman, S. A., with more than 40 papers each, are highly productive and have one tenth of the total output. Thus, Lotka's law is verified (Rousseau & Rousseau, 2000). Scattering through journals is also clear, confirming that there are currently 10 journals (Bradford's core) that feature a similar number of papers in 210 journals (zone 3; see Figure 3), which confirms the premise set out by Bradford's bibliometric law (Urbizagastegui, 2016). Thus, over these years, given the high number of documents published, a cluster of journals (e.g., BJET and IRRODL) have specialised in OUs.
Data revealed that The Open University UK is the institution with the greatest body of papers. It was founded in 1969 and has had a long history in distance and online education, offering learning opportunities to anyone who wants to study (Tait, 2013). Its consolidation as a global reference for research on OUs is demonstrated by the massive number of published papers, which distances it from the institution with the second highest output. Consequently, England is the key reference country not only because it was the place where the OU phenomenon originated, but also because of its broad scientific output. Moreover, there is a correlation between institutions and countries - the countries with OUs are those which produce more scientific publications on this topic. Some of these institutions have become the subjects of much of their own research.
However, these data showed that the impact of the key journals, institutions, countries, and authors does not depend solely on the number of papers. Rather, the number of citations also plays a major role in measuring impact. Therefore, some of those with fewer documents have had a greater scientific influence on the field.
To sum up, the number of documents and the setting of benchmarks on the topic highlighted the consolidation of the scope change brought by OUs; that is, student-centred learning (Rienties et al., 2016; 2017) with social justice principles (Tait, 2013) to bring education closer to the entire population, regardless of their socioeconomic status (Inouye et al., 2018; Lim et al., 2011; Lima et al., 2003).
With all these data it is possible to make some inferences concerning the trajectory the scientific output on OUs is taking. Among them, it is important to note the social implications of these institutions related to making higher education more universal, and its openness to adults, such as students over 50 years of age (Klimczak & Kossakowska, 2018).
We are looking at a booming topic which still has a long way to go. In line with its trend, it is expected that output on OUs will continue to increase for years to come. Applications of emerging methodologies, such as mobile learning, the Internet of Things, and artificial intelligence will be paramount for the continuity and development of OUs.
To conclude, this paper has answered the initial objective proposed about analysing scientific output on open universities from their origins in 1969 until 2018. In addition, the results show the answers to the research questions that guided the work: (a) state of production of OUs over time; (b) the productive relationship between the number of authors and papers is confirmed; (c) the concentration of most papers in a small number of journals; and (d) collecting the main journals, institutions, authors, and countries with the highest scientific output on OUs.
Avello-Martínez, R., & Anderson, T. (2015). Are the most highly cited articles the ones that are the most downloaded? A bibliometric study of IRRODL. International Review of Research in Open and Distributed Learning, 16(3), 18-40. doi: 10.19173/irrodl.v16i3.1754
Caballe, S., & Xhafa, F. (2013). Distributed-based massive processing of activity logs for efficient user modeling in a virtual campus. Cluster Computing, 16(4), 829-844. doi: 10.1007/s10586-013-0256-9
Cabrera, N., & Fernández-Ferrer, M. (2017). Examining MOOCs: A comparative study among educational technology experts in traditional and open universities. International Review of Research in Open and Distributed Learning, 18(2), 47-67. Retrieved from http://www.irrodl.org/index.php/irrodl/article/view/2789/4088
Cristino, T. M., Neto, A. F., & Costa, A.F. (2018). Energy efficiency in buildings: Analysis of scientific literature and identification of data analysis techniques from a bibliometric study. Scientometrics, 114(3), 1275-1326. doi: 10.1007/s11192-017-2615-4
Daga, E., d'Aquin, M., Adamou, A., & Brown, S. (2016). The Open University linked data - data.open.ac.uk. Semantic Web, 7(2), 183-191. Retrieved from http://oro.open.ac.uk/45433/
Glanzel, W. (2002). Coauthorship patterns and trends in the sciences (1980-1998): A bibliometric study with implications for database indexing and search strategies. Library Trends, 50(3), 461-473. Retrieved from https://goo.gl/W2dkYZ
Glanzel, W., & Schoepflin, U. (1999). A bibliometric study of reference literature in the sciences and social sciences. Information Processing & Management, 35(1), 31-44. doi: 10.1016/S0306-4573(98)00028-4
Gómez-García, A., Ramiro, M. T., Ariza, T., & Reina, M. (2012). Bibliometric study of Educación XX1. Educación XX1, 15(1), 17-41. doi: 10.5944/educxx1.15.1.148
González, J., Moya, M., & Mateos, M. A. (1997). Bibliometric indicators: Characteristics and limitations in the analysis of scientific activity. Anales Españoles de Pediatría, 47, 235-244. Retrieved from https://www.aeped.es/sites/default/files/anales/47-3-3.pdf
Gutiérrez, C., Martín, A., Casasempere, A., & Fernández, A. (2015). A scientometric analysis of grounded theory in education. Revista de Educación, 370, 121-148. doi: 10.4438/1988-592X-RE-2015-370-300
Hernández, V., Reverter, J., Jové, M. C., & Mayolas, M. C. (2013). Habits of publication of teachers of departments didactics of corporal expression and physical education in public universities Spanish. European Journal of Human Movement, 30, 1-12. Retrieved from https://www.eurjhm.com/index.php/eurjhm/article/view/296
Inouye, K., Souza, F., Lost, S. C., & Silva, E. (2018). Impact of the third age open university on the quality of life of the elderly. Educação e Pesquisa, 44, 1-18. doi: 10.1590/S1678-4634201708142931
Juliani, F., & de Oliveira, O. J. (2016). State of research on public service management: Identifying scientific gaps from a bibliometric study. International Journal of Information Management, 36(6), 1033-1041. doi: 10.1016/j.ijinfomgt.2016.07.003
Klimczak, A., & Kossakowska, S. (2018). Language learning over 50 at the Open University in Poland: An exploratory study of needs and emotions. Educational Gerontology, 44(4), 255-264. doi: 10.1080/03601277.2018.1454389
Lim, T., Fadzil, M., & Mansor, N. (2011). Mobile learning via SMS at Open University Malaysia: Equitable, effective, and sustainable. International Review of Research in Open and Distributed Learning, 12(2), 122-137. doi: 10.19173/irrodl.v12i2.926
Lima, K., Maia, E., Veras, I., Delgado, F. J., & Moreira, V. M. (2003). Demographic social-epidemiological profile of elderly women enrolled at the Open University program for senior citizens in the State of Pernambuco. Revista Brasileira de Saúde Materno Infantil, 3(3), 339-354. doi: 10.1590/S1519-38292003000300013
Olatunji, F., Afolake, R. O., & Kehinde, M. (2017). Analytical study of e-learning resources in National Open University of Nigeria. Education and Information Technologies, 22, 2403-2415. doi: 10.1007/s10639-016-9548-z
Open University of Catalonia. (1998). The Open University of Catalonia: Teaching and learning without distances. Comunicar, 10, 143-146. Retrieved from https://goo.gl/SQ85et
Paul, R. (1993). Open universities - The test of all models. In K. Harry, M. John, & D. Keegan (Eds.), Distance education: New perspectives (pp. 114-125). London, UK: Routledge.
Price, D. J. S. (1986). Little science, big science...and beyond. New York, NY: Columbia University Press.
Rangel, M. L., & Pereira, M. N. (2016). Mobile learning and interculturalism: Scientific production in post-graduate courses of the Open University of Lisbon. Revista Educação a Distância e Práticas Educativas Comunicacionais e Interculturais, 16(1), 95-114. Retrieved from https://repositorioaberto.uab.pt/handle/10400.2/5846
Rienties, B., Boroowa, A., Cross, S., Kubiak, C., Mayles, K., & Murphy, S. (2016). Analytics4Action evaluation framework: A review of evidence-based learning analytics interventions at The Open University UK. Journal of Interactive Media in Education, 1(2), 1-11. doi: 10.5334/jime.394
Rienties, B., Nguyen, Q., Holmes, W., & Reedy, K. (2017). A review of 10 years of implementation and research in aligning learning design with learning analytics at The Open University UK. Interaction Design and Architecture(s) Journal, 33, 134-154. Retrieved from http://oro.open.ac.uk/51188/
Rousseau, B., & Rousseau, R. (2000). LOTKA: A program to fit a power law distribution to observed frequency data. Cybermetrics, 4(1), 1-6.
Salmon, G. (2000). Computer mediated conferencing for management learning at The Open University. Management Learning, 31(4), 491-502. doi: 10.1177/1350507600314005
Tait, A. (2013). Distance and e-learning, social justice, and development: The relevance of capability approaches to the mission of open universities. International Review of Research in Open and Distributed Learning, 14(4), 1-18. doi: 10.19173/irrodl.v14i4.1526
Urbizagastegui, R. (2016). Growth of literature on Bradford's law. Investigación bibliotecológica, 30(68), 51-72. doi: 10.1016/j.ibbai.2016.06.003
Vermunt, J. (1998). The regulation of constructive learning processes. British Journal of Educational Psychology, 68, 149-171. doi: 10.1111/j.2044-8279.1998.tb01281.x
Zawacki-Richter, O., & Naidu, S. (2016). Mapping research trends from 35 years of publications in Distance Education. Distance Education, 37(3), 245-269. doi: 10.1080/01587919.2016.1185079

A Tour of Open Universities Through Literature: A Bibliometric Analysis by Francisco-Javier Hinojo-Lucena, Inmaculada Aznar-Díaz, María-Pilar Cáceres-Reche, and José-María Romero-Rodríguez is licensed under a Creative Commons Attribution 4.0 International License.