International Review of Research in Open and Distributed Learning
Volume 21, Number 3
September - 2020
Antecedents of Student Loyalty in Open and Distance Learning Institutions: An Empirical Analysis
Yon Rosli Daud*, Mohd Rushidi bin Mohd Amin, and Jeannot bin Abdul Karim
Open University Malaysia (OUM)
*corresponding author
Abstract
The purpose of this research is to examine the relationship between factors leading to student loyalty in open and distance learning universities. Specifically, this research explores the relationship between perceived service quality, perceived e-service quality, and university image as mediators of student loyalty in Open University Malaysia (OUM). Data were collected from 16 OUM learning centres throughout Malaysia. A purposive stratified convenience sampling technique was applied and a sample size of 752 respondents was obtained. The data indicated that perceived service quality has a positive and significant relationship with both university image and student loyalty. Similarly, it was found that perceived e-service quality has a positive significant relationship with both university image and student loyalty. University image acted as a mediator both in the relationship between perceived service quality and student loyalty, and in the relationship between perceived e-service quality and student loyalty.
Keywords: perceived service quality, perceived e-service quality, university image, student loyalty
Introduction
Higher education in Malaysia has evolved and transformed tremendously. The changes and trends in Malaysian education have been caused by globalization, new approaches to teaching and learning, new governance models, and the emergence of a knowledge-based society. Globalization has been defined as the opening of local and nationalistic perspectives to the broader outlook of an interconnected and interdependent world with free transfer of capital, goods, and services across national frontiers (Grapragasem, Krishnan, & Mansor, 2014). The education sector is projected to play an important role in long-term investments that highly potential lead to higher productivity (Manohar, 2018). Positive attitudes toward lifelong learning have resulted in the rapid emergence of lifelong learning providers (Li, 2018). In Malaysia, there were only six universities providing lifelong education in 2006; as of 2019, there were twenty-one public universities that offered distance education programmes in different modes. This situation has created very intense competition among providers.
Student loyalty is essential for educational providers to sustain or grow in the education business. Research on the antecedents of student loyalty in the education sector has concentrated more on service quality and, to the best of my knowledge, there has been no empirical research applying perceived e-service quality specifically in Malaysia. There is also a gap in the literature pertaining to the antecedents of student loyalty for part-time students whose classes are delivered in a blended mode of online and face-to-face teaching. This study is undertaken to address these gaps in the literature.
The intense competition as well as the challenges of delivering education to diverse learners in lifelong learning strengthen the need for research. A high attrition rate or lack of loyalty will lead to a reduction of financial revenue, extra costs of recruiting new students, and the loss of free advertising by word of mouth, particularly for educational institution providers adopting the online or blended learning approach. Therefore, student loyalty has become an important concern for lifelong learning providers (Li & Wong, 2019).
Literature Review
Theoretical Foundation of Student Loyalty
Studies have used the theory of reasoned action (TRA) as one of the bases of a research framework on brand loyalty and purchasing behaviour (Sulehri & Ahmed, 2017). According to the TRA, intentions have a direct effect on behaviour as an outcome of attitudes and subjective norms and are ideal for predicting consumer behaviour because of the voluntary nature of that behaviour (Shrum, Liu, Nespoli, & Lowrey, 2013). Predictions include consideration of current attitudes, subjective norms, and intentions to act. (Sheppard, Hartwick, & Warshaw, 1988).
The expectation disconfirmation theory (EDT) is rooted in the research of marketing and consumer behaviour (Oliver & DeSarbo, 1988). The usual approach to study satisfaction entails comparing initial expectations with observed performance. According to Oliver (1980), the EDT’s satisfaction is a function of initial expectations and disconfirmation, and satisfaction is the main determinant of repurchase intentions (Oliver, Balakrishnan, & Barry, 1994). The EDT is used in various areas of study such as marketing and consumer behaviour (Kopalle & Lehmann, 2001), service quality (Kettinger & Lee, 2005), and human resources (Hom, Griffeth, Palich, & Bracker, 1999). The common theme of study in expectation disconfirmation is the satisfaction function of size and direction of disconfirmation: consumers are satisfied in terms of positive disconfirmation and are not satisfied in the case of negative disconfirmation.
Perceived Service Quality
Service quality literature focuses on the relationship between customers’ expectations of service and perceptions of service quality (Grönroos, 1984). Grönroos (1984) explained that service quality is the result of customer evaluation of a course of action as that customer compares expected service with perceived service. For this reason, measuring service quality is important to business organizations and the instrument often used to measure service quality is the SERVQUAL or gap model (Parasuraman, Zeithaml, & Berry, 1985). Teeroovengadum, Kamalanabhan, and Keshwar (2016) proposed the Higher Education Service Quality scale (HESQUAL) in India and found that service quality is positively related to student satisfaction and loyalty. In addition, both Pedro, Mendes, and Lourenço (2018) and Wantara (2015) studied the determinants of student satisfaction using constructs of perceived service quality and found that perceived service quality is positively related to student satisfaction and student loyalty in the long run.
In this study, I conceptually define perceived service quality as the difference between the performance of service received with the actual expectation. Operationally, I define perceived service quality as the perception of customer experience, in all services provided by an organization, consisting of five dimensions: tangibility, reliability, responsiveness, assurance, and empathy. In line with previous studies and consolidating the idea that perceived service quality precedes student loyalty, this study considers perceived service quality as an antecedent to student loyalty that also has a positive relationship with student loyalty. Thus, the first hypothesis is as stated here:
H1: There is a positive relationship between perceived service quality and student loyalty.
Perceived E-Service Quality
Studies on e-services have looked at various aspects of e-service quality. E-services provided by the university include various electronic services that require no face-to-face or physical interaction between learners and the university, such as electronic registration, electronic payment, electronic seminars or tutorials, and live forums with tutors (Nsamba, 2019). Yoo and Donthu (2001) developed SITEQUAL, a psychometric measure of service quality for online shopping websites. Barnes and Vidgen (2002) developed WebQual 4.0 to assess the service quality of online bookstores in the UK and found three dimensions and five sub-dimensions that are significant in measuring the e-service quality of websites. These were defined as follows:
- usability (sub-dimensions usability and design): appearance, ease of use, ease of navigation;
- information quality (sub-dimension information): accuracy, format, and relevancy of information; and
- service interaction quality (sub-dimensions trust and empathy): transaction/information security, product delivery, personalization, and communication with website.
Ataburo, Muntaka, and Quansah (2017) stated that e-services should be designed to support the interactive flow of information between the customer and service provider. They indicated that the nature of e-service is to provide the customer with great experience with respect to the interactive flow of information. They also found that perceived e-service quality was closely related to customer satisfaction and loyalty.
I conceptually define perceived e-service quality as the difference between the performance of electronic services received with the expectation as suggested by researchers such as Ali (2019) and Alzoubi, Abdo, Al-Gasaymeh, and Alzoubi (2019). Operationally, I define perceived e-service quality as the perception of customer experience of all e-services provided by an organization, consisting of ease of use, website design, e-responsiveness, customization, and website security. In concurrence with previous studies and the idea that perceived e-service quality precedes student loyalty, this study considers perceived e-service quality as an antecedent to student loyalty, and thus, the second hypothesis is stated here:
H2: There is a positive relationship between perceived e-service quality and student loyalty.
University Image
University image is considered one of the important constructs in determining student loyalty in universities (Eskildsen, Dahlgaard, & Norgaard, 1999). It can be defined as the belief held by internal members of an organization of how outsiders view their organization, which has direct influence on the identity of that organization (Lievens, Hoye, & Anseel, 2007). I define university image as a summary of the perceptions held by people outside the organization that determine the reputation of that organization. University image has primarily been used as a positioning instrument to influence a student’s choice of a particular university (Alves & Raposo, 2010). Studies have found that a university’s positive image and reputation strongly affected retention and loyalty (Helgesen & Nesset, 2007). Alves and Raposo (2010) stated that positive university image significantly influences student satisfaction with direct and indirect effects. Khairani and Razak (2013) also found that positive university image significantly influences student loyalty and suggested that if universities wish to compete through image, first they need to measure that image based on student perception. Operationally, I define university image as the positive impression that a person holds towards an institution. Five hypotheses concerning university image were developed and are as follows:
H3: There is a positive relationship between university image and student loyalty.
H4: There is a positive relationship between perceived service quality and university image.
H5: There is a positive relationship between perceived e-service quality and university image.
H6: University image mediates the relationship between perceived service quality and student loyalty.
H7: University image mediates the relationship between perceived e-service quality and student loyalty.
Research Framework
The research framework illustrated in Figure 1 was adapted from Hassan et al., (2019). Although there is no consensus about the most appropriate determinants of student loyalty, this research has suggested the determinants to be perceived service quality and perceived e-service quality as independent constructs. The university image is proposed as the mediating construct and student loyalty as the dependent construct. The TRA and EDT theories support this model.
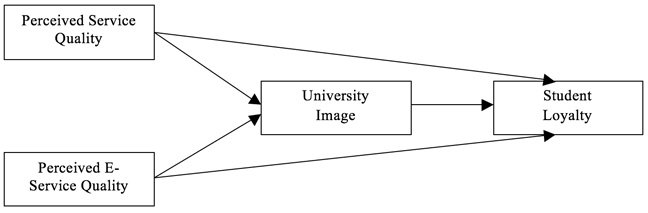
Figure 1. Theoretical framework. Adapted from “Mediating Effect of Corporate Image and Students’ Satisfaction on the Relationship between Service Quality and Students Loyalty in TVET HLIs,” by S. Hassan et al., 2019, Asian Academy of Management Journal, 24(Supp. 1), p. 97. Copyright 2019 by the Asian Academy of Management and Penerbit Universiti Sains Malaysia. Licenced under CC BY 4.0.
Methodology
Open University Malaysia has 16 learning centres throughout the country. The function of each learning centre is to execute and implement university academic activities such as tutorials, seminars, and quarterly colloquiums. Besides that, the learning centres also serve and carry out non-academic functions such as student affairs, student clubs, marketing, and promotional activities of the university.
This study, which adopted a cross-sectional survey approach, employed structured questionnaires for data collection. The questionnaires, which were distributed to all 16 Open University Malaysia OUM learning centres, were self-administered to give students privacy and time to answer the questions. The respondent in this study were the part-time students who are studying in a blended mode. Due to the nature of tutorial class scheduling and time constraints, most students had no time for interviews. A purposive stratified convenience sampling technique was applied. This technique reduced the random sampling error as it is internally homogeneous and results in smaller standard errors because the group is adequately represented when strata are combined. Another reason for using this sampling technique was to ensure that the samples accurately reflected the population based on criteria used for stratification. Samples of students were based on OUM’s Management Information System. Such a sample is deemed appropriate and acceptable in the scale development process when given evidence of internal consistency of the scale (DeVellis, 2016). The questionnaire was further evaluated and reviewed by OUM academics and students for suitability, readability, and ambiguity for content validity. The original items were modified to suit the research context in the open and distance learning setting.
Items addressing each construct were adapted from previous studies. For example, items concerning perceived service quality were adapted from Parasuraman, Zeithaml, and Berry (1988). Items for perceived e-service quality were adapted from Parasuraman et al., (1988) and Ribbink, Riel, Liljander, and Streukens (2004). Items related to university image were adapted from Huang, Yen, Liu, and Huang (2014), Johnson, Gustafsson, Andreassen, Lervik, and Cha (2001), Lemmink, Schuijf, and Streukens, (2003), Richard and Zhang (2012), Riordan, Gatewood, and Bill (1997) and Parasuraman et al., (1988). Lastly, items for student loyalty were adapted from Chen and Lee (2008) and Hennig-Thurau, Langer, and Hansen (2001).
The first pilot test was conducted on 30 students, and the questionnaire was revised based on feedback. The second pilot test was conducted by distributing the questionnaire to 50 students before conducting the main survey.
Results
Data Screening
A total of 1,600 questionnaires were distributed and 1,035 questionnaires were returned, giving a response rate of 64.6 percent. The collected questionnaires were inspected for completeness, patterns of response, and inconsistencies of answers followed by a coding process. Out of 1,035 questionnaires returned, a total of 752 were deemed eligible and analysis was conducted using the software SPSS Statistics 23.0. Data were screened to impose minimum quality standards on raw data. In this process, initial checks, missing data controls, and checks on the normalization of data distribution were performed. Extreme values caused by errors in data entry were identified by generating frequency tables. By observing the range of values for each item, the researcher was able to ensure the values fell within the coded end points. Student demographic profiles are shown in Table 1.
Table 1
Student Demographic Profile
| Demographic characteristic | n | % |
| Gender |
| Male | 247 | 32.85 |
| Female | 505 | 67.15 |
| Race |
| Malay | 428 | 56.91 |
| Chinese | 153 | 20.35 |
| Indian | 111 | 14.76 |
| Others | 60 | 7.98 |
| Age |
| ≤ 20 | 33 | 4.39 |
| 21-25 | 151 | 20.08 |
| 26-30 | 145 | 19.28 |
| 31-35 | 129 | 17.15 |
| 36-40 | 119 | 15.82 |
| 41-45 | 79 | 10.51 |
| 46-50 | 66 | 8.78 |
| 51-55 | 21 | 2.79 |
| 56-60 | 5 | 0.66 |
| 61-65 | 4 | 0.53 |
| Highest education level before enrolling at OUM |
| Lower than SPM | 7 | 0.93 |
| SPM or equivalent | 188 | 25 |
| STPM or equivalent | 136 | 18.09 |
| Diploma | 289 | 38.43 |
| Bachelor’s degree | 110 | 14.63 |
| Master’s degree | 22 | 2.93 |
| Programme pursued at OUM |
| Diploma | 80 | 10.64 |
| Bachelor’s degree | 528 | 70.21 |
| Master’s degree | 108 | 14.36 |
| Doctorate | 26 | 3.46 |
| Post Graduate Diploma | 10 | 1.33 |
| Cluster |
| Business and Management | 237 | 31.52 |
| Education and Applied Science Social | 376 | 50 |
| Applied Science | 139 | 18.48 |
Note. OUM = Open University Malaysia; SPM = Sijil Pelajaran Malaysia; STPM = Sijil Tinggi Pelajaran Malaysia.
Descriptive Analysis
Perceived service quality was chosen as one of the first constructs in measuring student loyalty. These five dimensions of perceived service quality were measured:
- tangibility
- reliability
- responsiveness
- assurance, and
- empathy.
Tangibility is defined as the appearance of physical facilities, equipment, personnel, printed, and visual materials. Reliability is defined as the ability to perform promised service dependably and accurately. Responsiveness is defined as the willingness to help customers to provide prompt service. Assurance is defined as the knowledge and courtesy of staff and their ability to convey trust, confidence, and empathy is define as caring and individualized attention.
To gain a better understanding of participants’ responses to these dimensions, I adapted several items for each dimension as follows:
- tangibility—4 items
- reliability—5 items
- responsiveness—4 items
- assurance—5 items, and
- empathy—4 items.
Items in this study are defined as the response items for the construct or a written set of questions to which the respondents record their answers, usually within defined alternatives. For example, in this study, items for reliability such as “When I have a problem, OUM shows keen and sincere interest in resolving it” and “OUM provides its service at the time it promised” were used. The standard deviation for all perceived service quality items ranged from 0.71 to 0.81. All perceived service quality item scores for skewness ranged from -0.58 to -0.07 and kurtosis scores ranged from 0.00 to 0.57. The results of the analysis indicated no violation of normality.
Perceived e-service quality was chosen as the second construct in measuring student loyalty. These five dimensions of perceived e-service quality were measured:
- ease of use
- website design
- responsiveness
- customization, and
- assurance.
Ease of use is defined as the functions that assist the help customers find what they need without difficulty, has good search functionality, and allows the customer to manoeuvre easily and quickly. Web design is defined as the benefit of online technologies in that the web site can be personalized to the user’s needs. Responsiveness is defined as quick feedback on requests by the customer and when they suggest improvements. Customization is defined as the personalization on how much and how easily the site can be tailored to individual customers’ preferences. Lastly, assurance is defined as the confidence the customer feels and is due to the reputation of the service provider and the products or services it offered, as well as clear and truthful information presented.
Similar to the previous construct, the dimensions were explored through participants’ responses to a number of items assigned to each dimension. However, in this case, items were defined for only three of the dimensions:
- ease of use—4 items
- website design—4 items
- responsiveness—4 items
- customization—4 items, and
- assurance—3 items.
All perceived e-service quality item scores for skewness ranged from -0.59 to 0.03 and kurtosis scores ranged from -0.49 to 0.59. The results of the analysis indicated no violation of normality.
As discussed in the Research Framework section of this study and shown in Figure 1, university image was selected as the mediating construct. There were seven items used to measure the level of the university image. The standard deviation for all university image items ranged from 0.68 to 0.74. The entire university image item scores for skewness ranged from -0.26 to -0.05 and kurtosis scores ranged from -0.42 to 0.01. The results of the analysis indicated no violation of normality.
Similarly, as discussed in the Research Framework and shown in Figure 1, student loyalty functioned as the dependent construct in this study. There were twelve items used to measure student loyalty. The student loyalty item scores for skewness ranged from -0.53 to -0.04 and kurtosis scores ranged from -0.53 to 0.56. The results of the analysis indicated no violation of normality.
Assessment of the Measurement Model
In this study, Analysis of Moment Structures (AMOS) software was used for covariance-based structural equation models (CB-SEM). The theoretical framework were transfer into AMOS graphic to further analyze its psychometric properties such as measurement model and structural model. The measurement models of the latent constructs were validated using confirmatory factor analysis (Awang, Afthanorhan, & Mamat, 2015). The latent constructs with multiple indicators and the observed variables were predicted in a model concurrently and simultaneously, and the interrelationships among the constructs, indicators and the observed variables were analysed using AMOS. AMOS is able to test simultaneously the measurement model (the relationships between indicators or manifest constructs and their corresponding constructs) and the structural model (the relationships between constructs). The measurement model was independently assessed before continuing with the structural model. This involved assessing the unidimensionality of each construct to achieve an acceptable measurement model for each construct and assess the model fit (Anderson & Gerbing, 1988).
As depicted in Figure 2, the analysis of the full measurement model was conducted by correlating all variables involved in the structural model. All variables were assumed to be correlated. Following Byrne (2010), modification indices and standardized residuals were examined to evaluate any specification errors in the model to achieve the required unidimensionality of the constructs. Covariance lines were drawn linking the following error terms: (a) e43 and e45, (b) e54 and e56, (c) e14 and e15, (d) e1 and e5, and (e) e1 and e8.
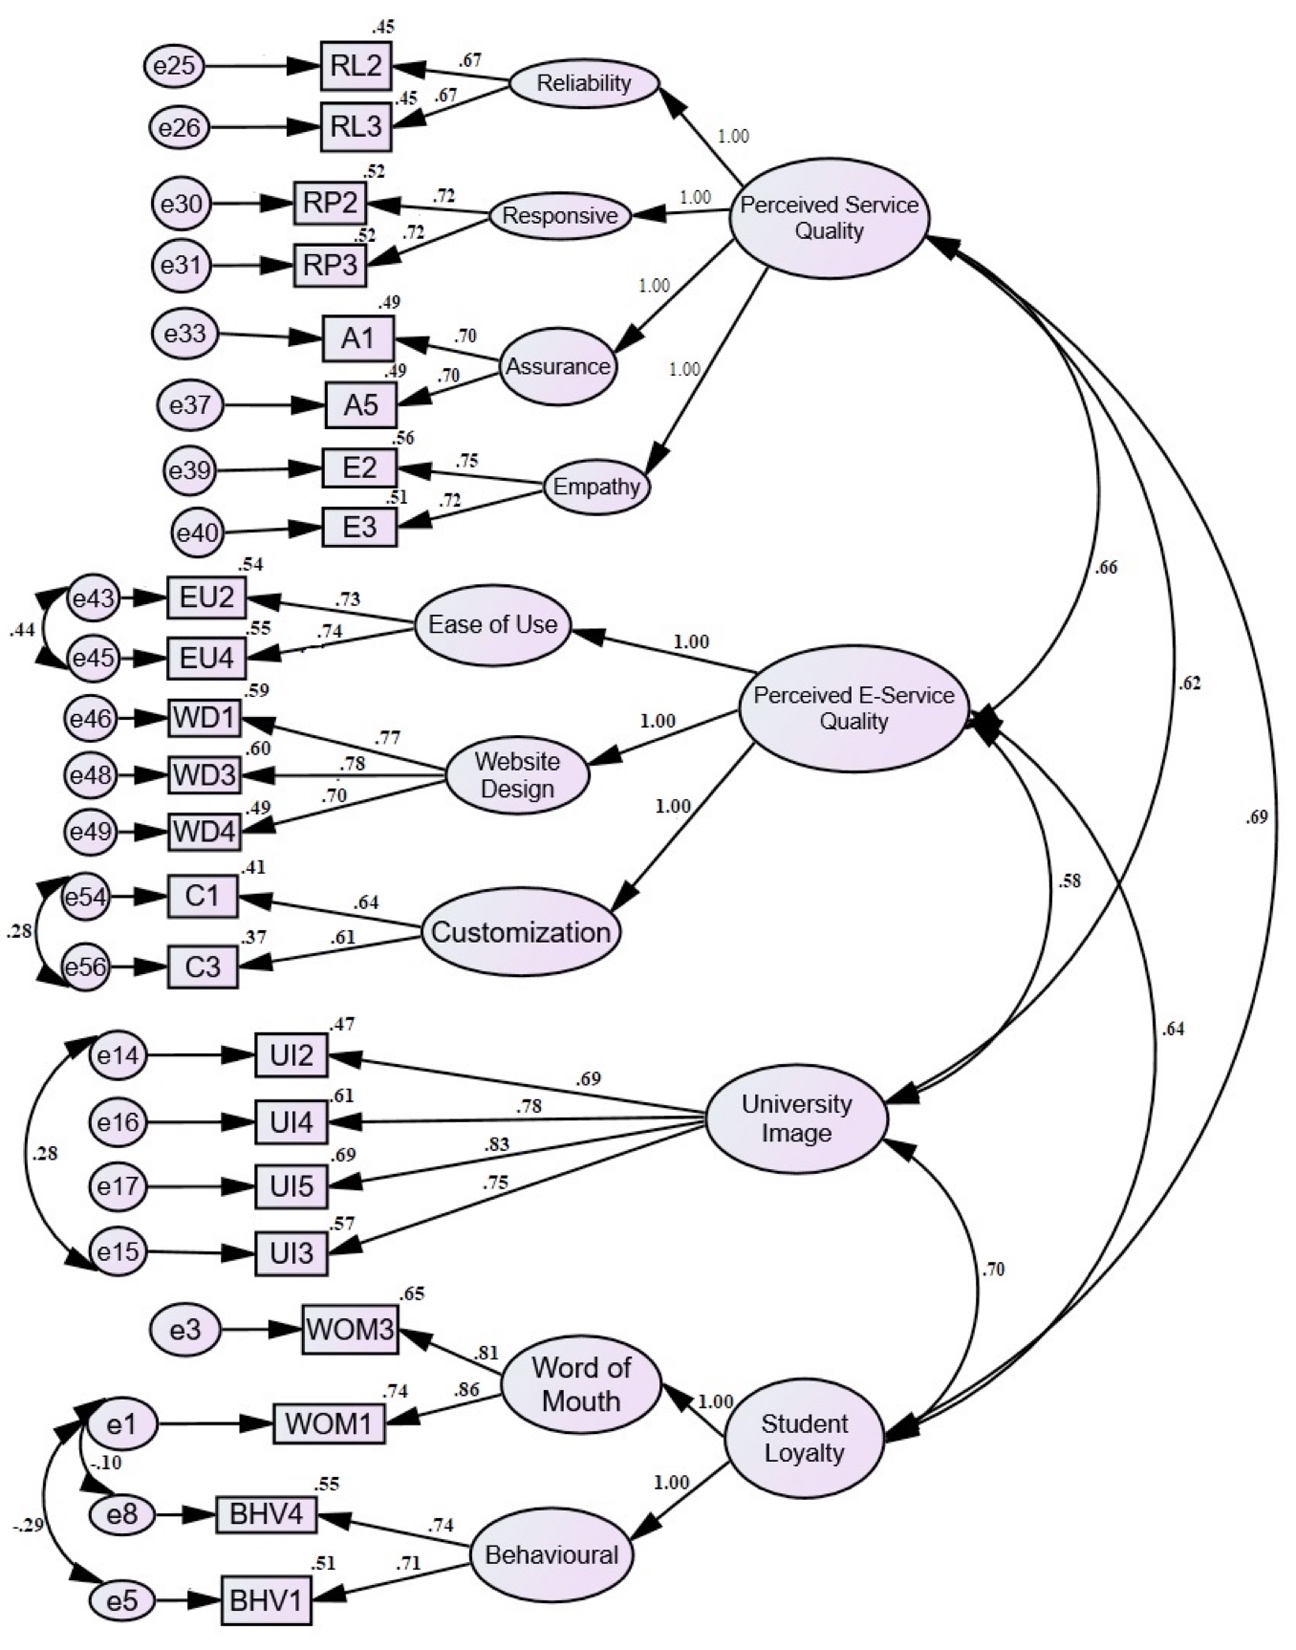
Figure 2. Assessment of full measurement model. RL = reliability; RP = responsiveness; A = assurance; E = empathy; EU = ease of use; WD = website design; C = customization; WOM = word of mouth; BHV = behavioural.
The results of goodness of fit indices indicate a well fit model with χ2/df = 3.506; Goodness of Fit index = 0.912; Adjusted Goodness of Fit index = 0.889; Tucker-Lewis index = 0.932; Comparative Fit index = 0.941; Normed Fit index = 0.920; Incremental Fit index = 0.941; and, RMSEA = 0.058. Based on the standardized regression weight, the standard loading ranged from 0.61 to 0.86 (see Figure 2). If the value obtained for AGFI is lower than the recommended threshold, i.e., the value does not exceed 0.9, it meets the requirement suggested by Baumgartner and Homburg (1996) and Doll, Xia, and Torkzadeh (1994). This was the case in this analysis. Thus, overall fit indicated no necessity to modify the relationships in the hypothesized model.
Discriminant validity occurs when unidimensionality is confirmed among the variables. The results of the individual CFA and full measurement model assessment indicated that all times were significant with standard factor loading ranging from 0.606 to 0.826. Based on the work on discriminant validity undertaken by Byrne (2010) and Awang, Afthanorhan, Mohamad, and Asri (2016), the square root of the average variance extracted (AVE) was calculated for each of the four constructs. Then, the AVE square roots were incorporated with the latent variables to determine how they were correlated with the independent variables as shown in Table 2. According to Awang, Afthanorhan, and Asri (2015), a correlation score lower than 0.85 is valid and indicates no redundancy. If the result is greater than 0.85, the researchers should delete either of the latent constructs since there would be an occurrence of construct redundancy. In this research, the requirement of discriminant validity was fulfilled, and, therefore, the measurement model was accepted as the structural model in the research.
Table 2
Results of Discriminant Validity Testing
| Latent constructs | 1 | 2 | 3 | 4 |
| Perceived service quality | 0.707 | | | |
| Perceived e-service quality | 0.656 | 0.711 | | |
| University image | 0.625 | 0.577 | 0.763 | |
| Student loyalty | 0.685 | 0.639 | 0.703 | 0.783 |
Hair, Black, Babin, and Anderson (2010) stated that factor loading is important to establish convergent validity. Anderson and Gerbing (1988) explained that convergent validity is achieved when all indicators have significant factor loadings, reflecting the effectiveness of the indicators to measure the same construct. In applying the CFA, the critical ratio (CR) for factor loadings is normally used to assess convergent validity (Bryne, 2010). Table 3, which shows the test results, indicates convergent validity as demonstrated by all factor loadings. The CRs values as seen in the Table 3 such as RL3, RP3, A5, E3 and so on are greater than 1.96, showing the achievement of significance level. The parameters were statistically significant as they exceeded the ± 1.96 benchmark (Arbuckle & Wothke, 1999).
Table 3
Results of Convergent Validity Testing Based on Factor Loadings
| | Beta estimate | Standard error | Critical ratio | p value |
| RL3 | ← RELIABILITY | 0.669 | 0.057 | 16.730 | *** |
| RL2 | ← RELIABILITY | 0.674 | | | |
| RP2 | ← REPESPONSIVE | 0.720 | | | |
| RP3 | ← REPESPONSIVE | 0.724 | 0.048 | 19.245 | *** |
| A5 | ← ASSURANCE | 0.698 | 0.061 | 17.454 | *** |
| A1 | ← ASSURANCE | 0.698 | | | |
| E3 | ← EMPATHY | 0.717 | 0.047 | 19.988 | *** |
| E2 | ← EMPATHY | 0.749 | | | |
| EU2 | ← EASE OF USE | 0.735 | | | |
| EU4 | ← EASE OF USE | 0.739 | 0.037 | 26.158 | *** |
| C1 | ← CUSTOMIZATION | 0.641 | 0.063 | 16.941 | *** |
| C3 | ← CUSTOMIZATION | 0.608 | | | |
| WD4 | ← WEBSITE DESIGN | 0.698 | | | |
| WD1 | ← WEBSITE DESIGN | 0.766 | 0.059 | 19.074 | *** |
| WD3 | ← WEBSITE DESIGN | 0.776 | 0.058 | 19.303 | *** |
| UI4 | ← UNIVERSITY IMAGE | 0.778 | | | |
| UI3 | ← UNIVERSITY IMAGE | 0.754 | 0.048 | 20.287 | *** |
| UI5 | ← UNIVERSITY IMAGE | 0.829 | 0.046 | 22.616 | *** |
| UI2 | ← UNIVERSITY IMAGE | 0.685 | 0.049 | 17.914 | *** |
| BHV4 | ← BEHAVIOURAL | 0.745 | 0.052 | 18.060 | *** |
| BHV1 | ← BEHAVIOURAL | 0.713 | | | |
| WOM1 | ← WORD OF MOUTH | 0.859 | | | |
| WOM3 | ← WORD OF MOUTH | 0.807 | 0.040 | 23.424 | *** |
Note. RL = reliability; RP = responsiveness; A = assurance; E = empathy; EU = ease of use; WD = website design; C = customization; WOM = word of mouth; BHV = behavioural.
In Table 3, each of the acronyms in Table 3 for example RL3 are define as Reliability 3, meaning, item 3 in Reliability dimension. EU2 are define as item 2 in Ease of Use dimension and WOM1 is define as item 1 in Word of Mouth dimension.
Analysis of a number of data, as shown in Table 4, reveal the reliability and construct validity of the measurement model. First, the CR values, all above 0.9, confirm that the threshold that determines unidimensionality of the constructs has been met.
Second, the AVE figures show convergence validity. According to Fornell and Larcker (1981), convergence validity can be measured using a percentage of the AVE. In this study, the AVE values for the constructs, ranging from 0.500 to 0.613, were all above Fornell and Larcker’s 0.5 recommended threshold.
Third, Cronbach’s &alpha, ranging from 0.849 to 0.888, was well above the threshold level of 0.7. Furthermore, when Cronbach’s α is combined with composite reliability, as is often done with structural equation models, together they can provide evidence of convergent validity (Kline, 2005). Hair et al., (2010) stated that a value greater than 0.7 suggests reliability and thus the results of this study indicate construct reliability and confirm again convergent validity.
Fourth, the maximum shared variance (MSV) and average shared variance (ASV) were determined in order to ensure that the theoretical research used for the measurement model was well defined. According to Hair et al., (2010), for a model to be valid, the MSV and ASV should be lower than 0.50. Based on the findings shown in Table 4, both the MSV and the ASV met this requirement.
Finally, Table 4 shows that convergent and discriminant validity exist for this measurement model as CR>AVE and AVE>0.50, while MSV<AVE and ASV<AVE respectively (Bagozzi & Yi, 1988; Fornell & Larcker, 1981; Gerbing & Anderson, 1988).
Table 4
Reliability and Construct Validity
| Latent constructs | CR (>0.5) | AVE (>0.5) | Cronbach’s α (>0.7) | MSV (<0.5) | ASV (<0.5) | Convergent validity | Discriminant validity |
| CR>AVE, AVE>0.50 | MSV<AVE, ASV<AVE |
| Perceived service quality | 0.993 | 0.500 | 0.888 | 0.469 | 0.430 | Yes | Yes |
| Perceived e-service quality | 0.991 | 0.506 | 0.881 | 0.408 | 0.371 | Yes | Yes |
| University image | 0.985 | 0.583 | 0.856 | 0.494 | 0.406 | Yes | Yes |
| Student loyalty | 0.991 | 0.613 | 0.849 | 0.494 | 0.457 | Yes | Yes |
Note. CR = composite reliability; AVE = average variance extracted; MSV = maximum shared variance; ASV = average shared variance.
Assessment of the Structural Model
The structural equation modelling procedure was conducted using the maximum likelihood fitting process (Gerbing & Anderson, 1988). The hypothesized relationships of the structural model were tested based on goodness of fit indices. The results indicated that the hypothesized model had an adequate fit, where χ2 / df = 4.268; Goodness of Fit index = 0.911; Adjusted Goodness of Fit index = 0.887; Tucker-Lewis index = 0.911; Comparative Fit index = 0.924; Normed Fit index = 0.904; Incremental Fit index = 0.924; and, RMSEA = 0.066. Figure 3 exhibits the structural model with standardized regression weights that indicate the significant relationships.
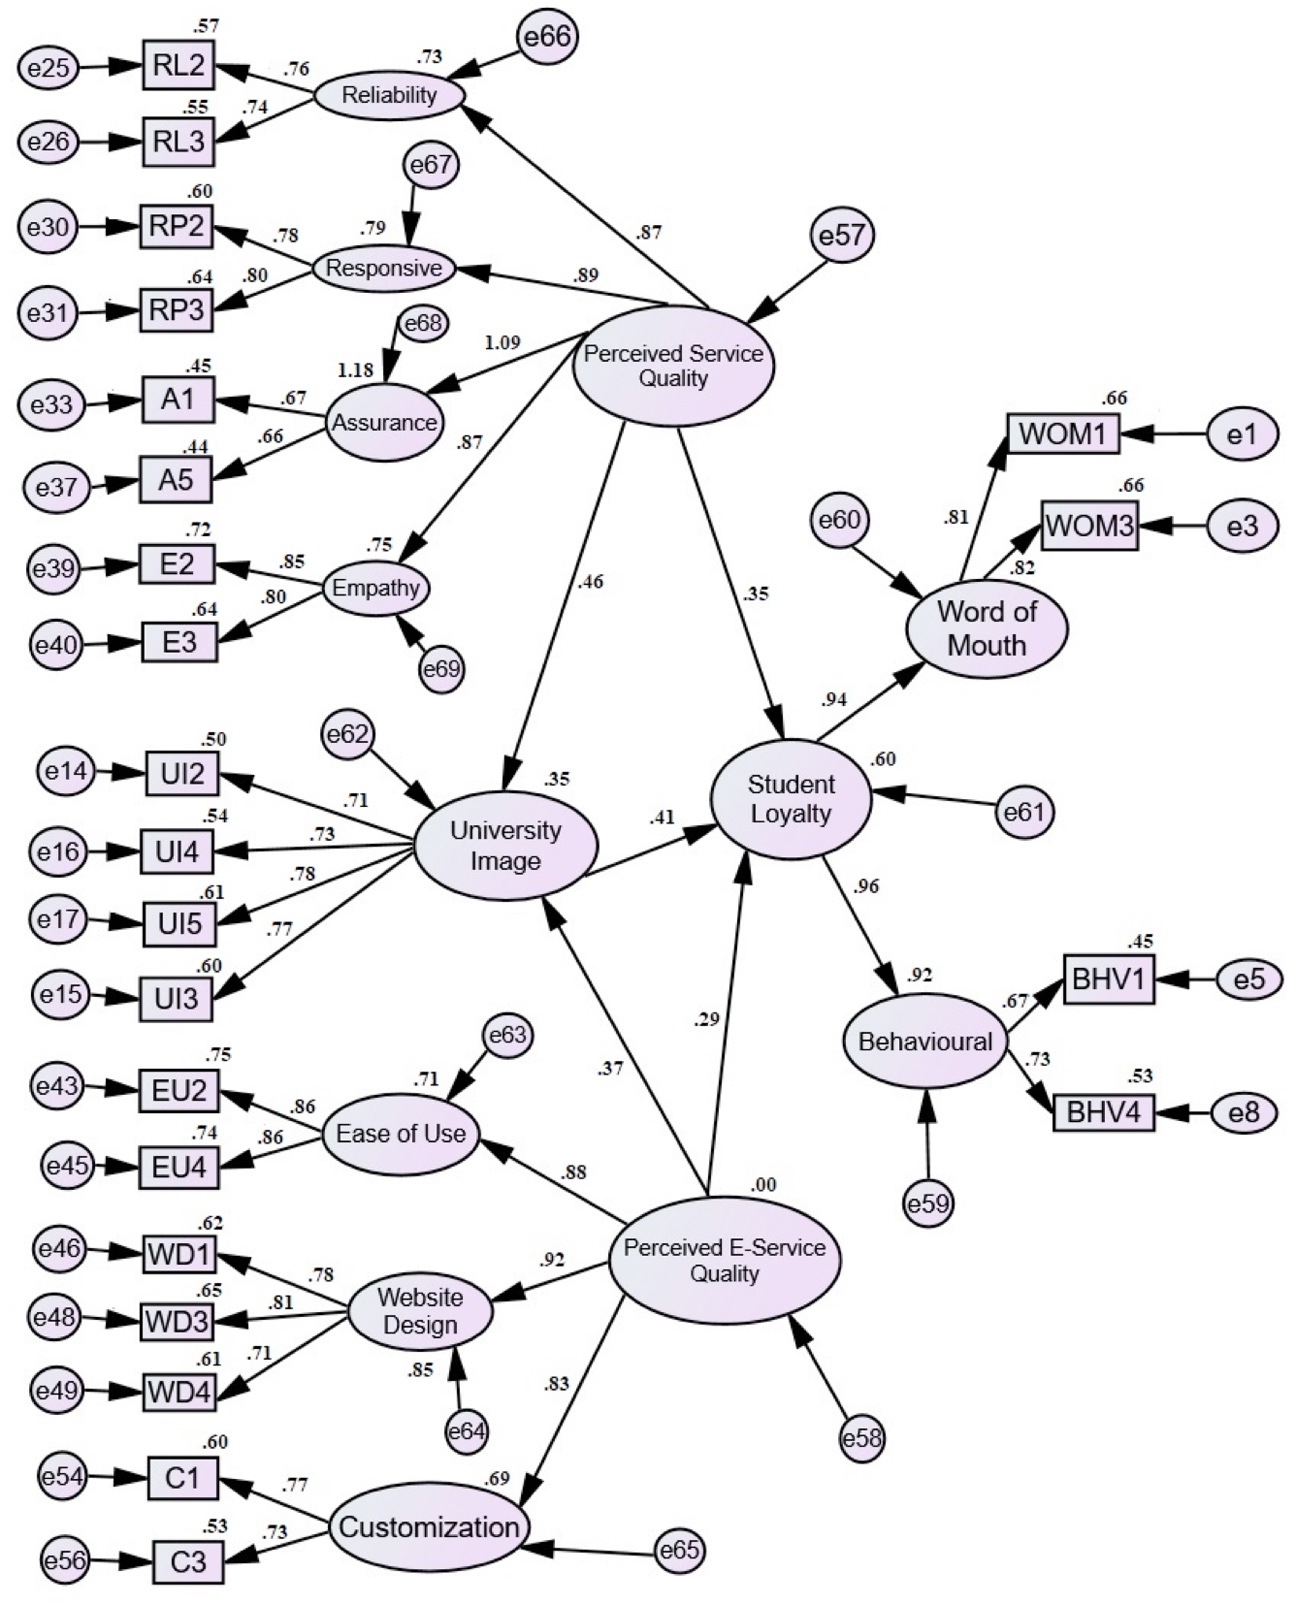
Figure 3. Structural model. RL = reliability; RP = responsiveness; A = assurance; E = empathy; EU = ease of use; WD = website design; C = customization; WOM = word of mouth; BHV = behavioural
The model in Figure 3 has 276 distinct sample moments. 60 parameters were freely estimated. Therefore, the hypothesised model was over-identified with 216 (276-60) degrees of freedom. Note that 216 is less than the sample moments of 276; according to Byrne (2010), an over-identified model is one in which the number of estimable parameters is less than the number of data points (i.e., variances and co-variances of the observed variables). This results in positive degrees of freedom that do not allow rejection of the model.
Table 5 presents a summary of the hypothesized relationships, standard errors of estimates, and p-values which were associated with the critical ratios. In this study, the hypotheses were accepted based on p-values <0.001 (considering 99.9% confidence interval) (Bagozzi & Yi, 1988).
Table 5
Test of Hypotheses
| No. | Determinants & constructs | Expected direction | Beta estimate | p value | Result |
| Direct relationship |
| H1 | Perceived service quality & student loyalty | +ve | 0.346 | *** | Supported*** |
| H2 | Perceived e-service quality & student loyalty | +ve | 0.294 | *** | Supported*** |
| H3 | Student loyalty & university image | +ve | 0.413 | *** | Supported*** |
| H4 | University image & perceived service quality | +ve | 0.458 | *** | Supported*** |
| H5 | University image & perceived e-service quality | +ve | 0.372 | *** | Supported*** |
| Indirect relationship |
| H6 | University image mediates the relationship between perceived service equality & student loyalty | | | | Partial mediation |
| H7 | University image mediates the relationship between perceived e-service equality & student loyalty | | | | Partial mediation |
Note. ***significant at p <0.001.
Discussion
The aim of this research was to examine the factors affecting student loyalty in the perspective of perceived service quality, perceived e-service quality, and university image in the context of open and distance learning. In Table 5, it is noted that all hypotheses were confirmed. The first objective of this study is to establish the relationship between perceived service quality and student loyalty, and it is found that the perceived service quality was positively and significantly associated with student loyalty. This finding indicated that a good and quality service delivered would bring benefits and advantage with the students in a long-term relationship and build up the student’s loyalty from time-to-time. This finding is consistent with previous studies such as Siddiqi (2011) and Sultan and Wong (2012).
The second objective of this study is to establish the relationship between perceived e-services quality and student loyalty, and the results of the analysis shown that perceived e-service quality has a positive influence on student loyalty. It means that the implementation of effective and efficient activities of perceived e-service quality will increase the level of student loyalty. It is no doubt that the implementation of e-service quality would bring many benefits to the university as it makes the service delivered much faster, more convenient, and more reliable to the students. This finding is in line with Ribbink et al. (2004) and Wantara (2015).
The third objective of this study is to establish the relationship between university image and student loyalty, and it is found that the university image had a positive influence on the student loyalty. This finding indicated that ability to perform activities that projected a good image of the university will lead to higher level of student loyalty and bring confidence to the students that they are in the right path, enrolled in the right institutions and eventually gaining their devotion on long term basis. This finding is in line with past studies such as Bloemer and Ruyter (1998) and Nguyen and Leblanc (2001).
The fourth objective of this study is to establish the relationship between perceived service quality and university image. It is found that the university image had a positive influence on the student loyalty and this finding indicated that the university’s ability to perform activities that demonstrated good service quality will influence and lead to a better positive image of the university. A reliable, guarantee and fast service would influence the customers to have higher expectation towards the institution to provide a better and quality service from other educational institutions. This finding is consistent with past studies such as Nguyen and Leblanc (2001) and Helgesen and Nesset (2007).
The fifth objective of this study is to establish the relationship between perceived e-service quality and university image. It is found that the perceived e-service quality had a positive influence on the university image and this shows that the e-service provided in terms of ease of use of the institutions online platform, customization, and good website design would provide a faster and better e-service for the university customer. The usage of digital platform in providing service for the customer is a must in the current business practice including higher education institutions as it is much more convenient and faster, but most importantly, it will save cost and time for the institution’s customer. This finding is in line with similar studies (Alves & Raposo, 2010; Khairani & Razak, 2013).
The sixth objective of this study is to establish the mediation effect of the university image between the relationships of perceived service quality and student loyalty. From the finding, it is confirmed that the university image has a partial mediating effect on the relationship between perceived service quality and student loyalty. This finding is important as past literatures only support the significant direct effect between perceived service quality and student’s loyalty but the significance of indirect effect of university image remains unexplored. This study provides the empirical evidence that shows the significance of indirect effect of the university image and highlighted the importance of the inclusion of university image as part of the university’s competitive business strategy in gaining student support and loyalty (Khairani & Razak, 2013). The effect of university image should not be ignored by the university and it can be an advantage for the university to capitalize the undeniable positive effect in the current competitive business environment.
Finally, the seventh objective of this study is to establish the mediation effect of university image between the relationship of perceived e-service quality and student loyalty. It is found that university image has a partial mediating effect. Past literatures only show the significant direct effect between perceived e-service quality and students’ loyalty but the significance of indirect effect of university image is often neglected. This study provides the empirical evidence of the significance of indirect effect of university image and the importance of this effect should not be ignored by the university. Beyond any doubt that e-service would benefit both the service provider and their customer in the current digital era, e-service is meant to increase the effectiveness of the university and eliminate unnecessary cost in serving their students. The significance of university image would indirectly enhance the student loyalty as they perceived that the university provides a quality e-service that would benefit them in the future.
Therefore, by referring back the findings of this study, it is highly potential that the research model contributes to overall service quality of the university. Although this study focuses on the students as the respondent, future research is highly recommended to take survey or opinion of the university staff, parents, and others for a more holistic approach to improve further the university service quality initiative. The focus of this study is not merely concentrated on the part-time students but the students who are working adults that may demonstrate dissimilar behaviour compared to other full-time or part-time students. The research model paved the way and it is highly potential to expand the existing literature in service quality or e-service quality in open and distance learning context.
Conclusion
The research provides useful information to academics, practitioners, and policy makers by showing that service quality is strongly correlated to student loyalty and university image. Various strategies could be implemented to improve service quality. For example, it is recommended that feedback from employees on the reasons for low scores in service delivery be collected and then analysed. Furthermore, it is recommended that service quality be regularly monitored. In addition, training in service delivery is suggested to improve quality. In another perspective, this study opens the way for the university to become more customer oriented rather than product centric or mass product customization.
The university should enhance their current business strategy planning based on the findings of this study and maximize the value created by each student by satisfying their needs. Attaining student loyalty is the main objective of this study as it provides a vital non-financial metric for the university such as student satisfaction, student lifetime value, and student equity.
This research has also shown that a positive university image will likely result in greater student loyalty. When students are proud of their university, they are more likely to convey a positive message when discussing their experiences with other people. Several initiatives that could be undertaken by a university to improve its image include maintaining strong academic and student profiles, using success stories in promotion activities, distributing awards, sustaining good infrastructure and positive ambiance, and associating with like-minded partners, including government agencies such as the Ministry of Higher Education, Malaysia Qualification Agency (MQA), and others higher education institutions that provide open and distance learning mode in the country or in the South East Asia region.
The findings of this study could be used by the administration of open and distance learning universities for further business improvement such as business differentiation strategy to differentiate them from other competitors. Differentiation has now become more difficult and more important for universities as currently many higher education institutions offer the same service and similar academic courses. Moreover, student’s loyalty is the key to long term profitability and plays an important role in increasing revenues, and thus service quality is linked to business profits.
The research model is applicable to others public or private agency including higher education institutions who are interested in testing or further expanding the research model with their own discretion. A comparison studies in the country or in the region is also recommended as it might reveal more interesting findings. Future research can use scales to test other theoretical propositions such as satisfaction, retentions, and attritions, which illustrate how the behaviour of consumers or other areas is influenced by the perceived service quality and perceived e-service quality.
This study has reviewed and verified the dimensions of perceived service quality, perceived e-service quality, and university image and student loyalty with quantitative techniques. This was done in the context of OUM students and it would be desirable if any comparison studies can be conducted between part-time students (i.e., working adult and full-time student). It is also suggested that a comparison study to be conducted between public universities and private universities. Another limitation is that this study was cross-sectional so there was no causal relationship that can be claimed, only the association that shows the relationship between the various contributions rendered by the perceived service qualities constructs.
References
Ali, H. (2019). Measurement of e-services quality: An empirical study of University of Bahrain. Education and Information Technologies, 24, 1907-1924. doi: 10.1007/s10639-018-9775-6
Alves, H., & Raposo, M. (2010). The influence of university image on student behaviour. International Journal of Educational Management, 24(1), 73-85. doi: 10.1108/09513541011013060
Alzoubi, H.M., Abdo, M., Al-Gasaymeh, A., & Alzoubi, A.A. (2019). An empirical study of e-service quality and its impact on achieving a value added. Journal of Business & Retail Management Research, 13(4), 138-145. doi: 10.24052/jbrmr/v13is04/art-12
Anderson, J.C., & Gerbing, D.W. (1988). Structural equation modeling in practice: A review and recommended two-step approach. Psychological Bulletin, 103(3), 411-423. doi: 10.1037/0033-2909.103.3.411
Arbuckle, J., & Wothke, W. (1999). AMOS 4.0 user’s guide. Chicago, IL: Smallwaters Corporation.
Ataburo, H., Muntaka, A.S., & Quansah, E.K. (2017). Linkages among e-service quality, satisfaction, and usage of e-services within higher educational environments. International Journal of Business and Social Research, 7(3), 10-26. doi: 10.18533/ijbsr.v7i3.1040
Awang, Z., Afthanorhan, A., & Asri, M.A.M. (2015). Parametric and non parametric approach in structural equation modeling (SEM): The application of bootstrapping. Modern Applied Science, 9(9), 58-67. doi: 10.5539/mas.v9n9p58
Awang, Z., Afthanorhan, A., & Mamat, M. (2015). The Likert scale analysis using parametric based structural equation modeling (SEM ). Computational Methods in Social Sciences, 4(1), 13-21.
Awang, Z., Afthanorhan, A., Mohamad, M., & Asri, I.A. (2016). An evaluation of measurement model for medical tourism research: The confirmatory factor analysis approach. International Journal of Tourism Policy, 6(1), 29-45. doi: 10.1504/IJTP.2015.075141
Bagozzi, R.P., & Yi, Y. (1988). On the evaluation of structural equation models. Journal of the Academy of Marketing Science, 16(1), 74-94. doi: 10.1007/BF02723327
Barnes, S.J., & Vidgen, R.T. (2002). An integrative approach to the assessment of e-commerce quality. Journal of Electronic Commerce Research, 3(3), 114-127. Retrieved from http://www.jecr.org/node/271
Baumgartner, H., & Homburg, C. (1996). Applications of structural equation modeling in marketing and consumer research: A review. International Journal of Research in Marketing, 13(2), 139-161. doi: 10.1016/0167-8116(95)00038-0
Bloemer, J., & de Ruyter, K. (1998). On the relationship between store image, store satisfaction and store loyalty. European Journal of Marketing, 32(5/6), 499-513. doi: 10.1108/03090569810216118
Byrne, B.M. (2010). Structural equation modeling with AMOS: Basic concepts, applications, and programming (2nd ed.). New York: Routledge.
Chen, C.-H., & Lee, H.-Y. (2008). Empirical analysis of the customer loyalty problem in the international logistics market. WSEAS Transaction on Business Economics, 4(5), 113-123.
DeVellis, R.F. (2016). Scale development theory and applications (4th ed.). Washington, DC: Sage Publications.
Doll, W.J., Xia, W., & Torkzadeh, G. (1994). A confirmatory factor analysis of the end-user computing satisfaction instrument. MIS Quarterly, 18(4), 453-461. doi: 10.2307/249524
Eskildsen, J.K., Dahlgaard, J.J., & Norgaard, A. (1999). The impact of creativity and learning on business excellence. Total Quality Management, 10(4-5), 523-530. doi: 10.1080/0954412997488
Fornell, C., & Larcker, D.F. (1981). Evaluating structural equation models with unobservable and measurement error. Journal of Marketing Research, 18(1), 39-50. doi: 10.2307/3151312
Gerbing, D.W., & Anderson, J.C. (1988). An updated paradigm for scale development incorporating unidimensionality and its assessment. Journal of Marketing Research, 25(2), 186-192. doi: 10.2307/3172650
Grapragasem, S., Krishnan, A., & Mansor, A.N. (2014). Current trends in Malaysian higher education and the effect on education policy and practice: An overview. International Journal of Higher Education, 3(1), 85-93. doi: 10.5430/ijhe.v3n1p85
Grönroos, C. (1984). A service quality model and its marketing implications. European Journal of Marketing, 18(4), 36-44. doi: 10.1108/EUM0000000004784
Hair, J.F., Black, W.C., Babin, B.J., & Anderson, R.E. (2010). Multivariate data analysis (7th ed.). Upper Saddle River, NJ: Prentice Hall.
Hassan, S., Shamsudin, M.F., Hasim, M.A., Mustapha, I., Jaafar, J., & Adruthdin, K.F. (2019). Mediating effect of corporate image and students’ satisfaction on the relationship between service quality and students’ loyalty in TVET HLIs. Asian Academy of Management Journal, 24(1), 93-105. doi: 10.21315/aamj2019.24.s1.7
Helgesen, Ø., & Nesset, E. (2007). What accounts for students’ loyalty? Some field study evidence. International Journal of Educational Management, 21(2), 126-143. doi: 10.1108/09513540710729926
Hennig-Thurau, T., Langer, M.F., & Hansen, U. (2001). Modeling and managing student loyalty: An approach based on the concept of relationship quality. Journal of Service Research, 3(4), 331-344. doi: 10.1177/109467050134006
Hom, P.W., Griffeth, R.W., Palich, L.E., & Bracker, J.S. (1999). Revisiting met expectations as a reason why realistic job previews work. Personnel Psychology, 52(1), 97-112. doi: 10.1111/j.1744-6570.1999.tb01815.x
Huang, C.-C., Yen, S.-W., Liu, C.-Y., & Huang, P.-C. (2014). The relationship among corporate social responsibility, service quality, corporate image and purchase intention. International Journal of Organizational Innovation, 6(3), 68-84.
Johnson, M., Gustafsson, A., Andreassen, T.W., Lervik, L., & Cha, J. (2001). The evolution and future of national customer satisfaction index models. Journal of Economic Psychology, 22(2), 217-245. doi: 10.1016/S0167-4870(01)00030-7
Kettinger, W.J., & Lee, C.C. (2005). Zones of tolerance: Alternative scales for measuring information systems service quality. MIS Quarterly, 29(4), 607-621. doi: 10.2307/25148702
Kline, R. B. (2005). Principles and practices of structural equation modeling (2nd ed.). The Guilford Press.
Khairani, A.Z. bin, & Razak, N. bin A. (2013). Assessing factors influencing students’ choice of Malaysian public university: A Rasch model analysis. International Journal of Applied Psychology, 3(1), 19-24. Received from http://article.sapub.org/10.5923.j.ijap.20130301.04.html
Kopalle, P.K., & Lehmann, D.R. (2001). Strategic management of expectations: The role of disconfirmation sensitivity and perfectionism. Journal of Marketing Research, 38(3), 386-394. doi: 10.1509/jmkr.38.3.386.18862
Lemmink, J., Schuijf, A., & Streukens, S. (2003). The role of corporate image and company employment image in explaining application intentions. Journal of Economic Psychology, 24(1), 1-15. doi: 10.1016/S0167-4870(02)00151-4
Li, F. (2018). The expansion of higher education and the returns of distance education in China. International Review of Research in Open and Distributed Learning, 19(4), 242-256. doi: 10.19173/irrodl.v19i4.2881
Li, K.C., & Wong, B.T.-M. (2019). Factors related to student persistence in Open Universities: Changes over the years. International Review of Research in Open and Distributed Learning, 20(4), 133-151. doi: 10.19173/irrodl.v20i4.4103
Lievens, F., Van Hoye, G., & Anseel, F. (2007). Organizational identity and employer image: Towards a unifying framework. British Journal of Management, 18, 45-58. doi: 10.1111/j.1467-8551.2007.00525.x
Manohar, S. (2018). Mediation effect of service quality between service innovation and customer word-of-mouth in Indian higher education system. International Journal of Business Excellence, 16(2), 127-148. doi: 10.1504/IJBEX.2018.094701
Nguyen, N., & Leblanc, G. (2001). Corporate image and corporate reputation in customers’ retention decisions in services. Journal of Retailing and Consumer Services, 8(4), 227-236. doi: 10.1016/S0969-6989(00)00029-1
Nsamba, A. (2019). Maturity levels of student support e-services within an open distance e-learning university. International Review of Research in Open and Distributed Learning, 20(4), 61-78. doi: 10.19173/irrodl.v20i4.4113
Oliver, R.L. (1980). A cognitive model of the antecedents and consequences of satisfaction decisions. Journal of Marketing Research, 17(4), 460-469. doi: 10.2307/3150499
Oliver, R.L., Balakrishnan, P.V. (Sundar), & Barry, B. (1994). Outcome satisfaction in negotiation: A test of expectancy disconfirmation. Organizational Behavior and Human Decision Processes, 60(2), 252-275. doi: 10.1006/obhd.1994.1083
Oliver, R.L., & DeSarbo, W.S. (1988). Response determinants in satisfaction judgments. Journal of Consumer Research, 14(4), 495-507. Retrieved from https://www.jstor.org/stable/2489156
Parasuraman, A., Zeithaml, V.A., & Berry, L.L. (1985). A conceptual model of service quality and its quality and implications for future research. Journal of Marketing, 49(4), 41-50. doi: 10.2307/1251430
Parasuraman, A., Zeithaml, V.A., & Berry, L.L. (1988). SERVQUAL: A multiple item scale for measuring consumer perceptions of service quality. Journal of Retailing, 64(1), 12-40. Retrieved from https://psycnet.apa.org/record/1989-10632-001
Pedro, E., Mendes, L., & Lourenço, L. (2018). Perceived service quality and students’ satisfaction in higher education: The influence of teaching methods. International Journal for Quality Research, 12(1), 165-192. doi: 10.18421/IJQR12.01-10
Ribbink, D., van Riel, A.C.R., Liljander, V., & Streukens, S. (2004). Comfort your online customer: Quality, trust and loyalty on the internet. Managing Service Quality: An International Journal, 14(6), 446-456. doi: 10.1108/09604520410569784
Richard, J.E., & Zhang, A. (2012). Corporate image, loyalty, and commitment in the consumer travel industry. Journal of Marketing Management, 28(5-6), 568-593. doi: 10.1080/0267257X.2010.549195
Riordan, C.M., Gatewood, R.D., & Bill, J.B. (1997). Corporate image: Employee reactions and implications for managing corporate social performance. Journal of Business Ethics, 16(4), 401-412. doi: 10.1023/A:1017989205184
Sheppard, B.H., Hartwick, J., & Warshaw, P.R. (1988). The theory of reasoned action: A meta-analysis of past research with recommendations for modifications and future research. Journal of Consumer Research, 15(3), 325-343. doi: 10.1086/209170
Shrum, L.J., Liu, M., Nespoli, M., & Lowrey, T.M. (2013). Persuasion in the marketplace: How theories of persuasion apply to marketing and advertising. In J.P. Dillard & L. Shen (Eds.), The SAGE handbook of persuasion: Developments in theory and practice (pp. 314-330). Thousand Oaks, CA, US: Sage Publications.
Siddiqi, K.O. (2011). Interrelations between service quality attributes, customer satisfaction and customer loyalty in the retail banking sector in Bangladesh. International Journal of Business and Management, 6(3), 12-36. doi: 10.5539/ijbm.v6n3p12
Sulehri, N.A., & Ahmed, M. (2017). Theory of reasoned action and retail agglomerations buying behavior for urban consumers. The Business and Management Review, 9(2), 263-266. Retrieved from https://www.researchgate.net/publication/323028031_Theory_of_reasoned_action_and_retail_agglomerations_buying_behavior_for_urban_consumers
Sultan, P., & Wong, H.Y. (2012). Service quality in a higher education context: An integrated model. Asia Pacific Journal of Marketing and Logistics, 24(5), 755-784. doi: 10.1108/13555851211278196
Teeroovengadum, V., Kamalanabhan, T.J., & Seebaluck, A.K. (2016). An analysis of higher education service quality in Mauritius using HESQUAL. International Journal of Business Research, 16(2), 89-104. doi: 10.18374/IJBR-16-2.7
Wantara, P. (2015). The relationships among service quality, customer satisfaction, and customer loyalty in library services. International Journal of Economics and Financial Issues, 5(1), 264-269. Retrieved from https://www.econjournals.com/index.php/ijefi/article/view/1390/pdf
Yoo, B., & Donthu, N. (2001). Developing and validating a multidimensional consumer-based brand equity scale. Journal of Business Research, 52(1), 1-14. doi: 10.1016/S0148-2963(99)00098-3


Antecedents of Student Loyalty in Open and Distance Learning Institutions: An Empirical Analysis by Yon Rosli Daud, Mohd Rushidi bin Mohd Amin, and Jeannot bin Abdul Karim is licensed under a Creative Commons Attribution 4.0 International License.