Volume 22, Number 2
Hanife Çivril1 and Ali Ekrem Özkul2
1Isparta University of Applied Sciences, Turkey; 2Alanya Hamdullah Emin Paşa University, Turkey
Laboratories, which are an integral part of education in disciplines that require hands-on training and application, can now be presented using new technologies, and application activities can be realized at a distance. In this study, virtual laboratories (VLs) are discussed, and factors affecting the students’ intention to use VLs are investigated. The study was conducted within laboratory applications of circuit analysis within an associate degree program of a distance teaching university in Turkey. In this study, which used exploratory sequential design approach, the learners’ intentions to use a VL were examined within the framework of the technology acceptance model (TAM). Content analysis was used for the analysis of qualitative data, and the partial least squares structural equation model was used for the analysis of quantitative data. As a result of the study, the developed TAM-based research model is a useful conceptual framework towards understanding and explaining the intentions of learners’ virtual laboratory usage. The results of this study will guide institutions to integrate VLs effectively into the education process and to increase and disseminate the use of VLs by learners.
Keywords: virtual laboratories, open learning, distance education, technology acceptance
Laboratory practices, which are defined as learning experiences in which the learners interact with the material to observe theoretically taught events (Hofstein & Lunetta, 1982), are considered an integral part of education in various disciplines. They aim to develop learners’ application skills such as observation, measurement, estimation, planning, hypothesis building, problem solving, collaboration, data acquisition, interpretation of results, and time management (Kennepohl, 2013; Meester & Kirschner, 1995). In addition, learners are taught the skills they should possess in their business life after they graduate.
While the effective design of laboratories in a traditional way and their presentation to students is not an easy undertaking, institutions that offer open learning and distance education experience more difficulties (Kennepohl, 2013) due to learners’ obvious geographical distance from the laboratory facilities. In open and distance learning, which gained more popularity with the establishment of the Open University in the United Kingdom in 1969, various methods, such as face-to-face laboratories, home study kits, remote laboratories, virtual laboratories, and fieldwork and clinics, are employed to provide high-quality laboratory experiences to distance learners, as exemplified by Kennepohl (2017).
Virtual laboratories (VLs) are one of the solutions put forward in the digital age for flexible and accessible laboratory applications. VLs simulate a real laboratory environment by way of a variety of softwares. They allow learners to conduct experiments independent of time and place. Thus, learners can be more comfortable in designing experiments and analyzing and interpreting results (Stefanovic, 2013). Learners explore knowledge by interacting with the virtual environment (Dalgarno, 2002).
A number of studies show that VLs make important contributions to learning and teaching (e.g., Hung & Tsai, 2020; Wolski & Jagodzinski, 2019). Although the effectiveness of VLs is often stated, the fact that they are not adopted and used by all learners will prevent the success of this laboratory practice. It is therefore important for institutions to know the factors that affect learners’ intentions to use or not use a VL. Understanding these factors will guide institutions in ensuring that VLs are adopted and used by more learners and will enable them to take steps in this direction.
This study aims to discover the factors affecting open and distance learning (ODL) learners’ intentions to use VLs in terms of their opinions of VL experiences.
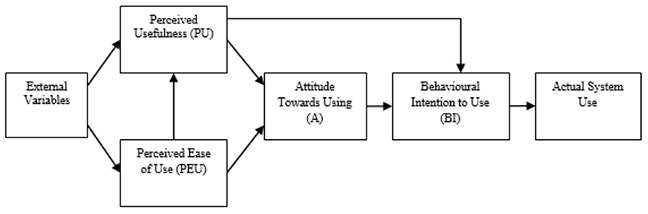
Technology acceptance can be defined as the process of people accepting and using a technology or their intent to use it. The acceptance of technology has become an important field of study as information technologies have begun to be implemented in almost every field. Many technological or psychological factors affect people’s decisions to use and/or their behaviours in using technological systems. Various theories have emerged to reveal and understand these factors. One of these theories is the technology acceptance model (TAM). Proposed by Davis et al. (1989), the TAM, as shown in Figure 1, has two important factors: perceived usefulness (PU) and perceived ease of use (PEU). These factors directly influence attitudes (A) towards technology use. PU is defined as the perception that the use of a certain technological system increases the work performance of a person (Davis et al., 1989). In other words, people tend to use technology (or not) to the extent to which they believe it helps them to do their jobs better. On the other hand, some people may not accept technology unless it is easy to use, even if it is perceived as useful. PEU is the belief that individuals can use a system without too much effort; PEU directly affects PU. Finally, these two beliefs are assumed to be directly influenced by external variables (Davis et al., 1989).
In this model, a system’s use is determined directly by the behavioural intention (BI), which is influenced by both human attitudes towards the system and PU. The relationship between attitude and BI is described as follows: People are intent on realizing the behaviors that they feel positively towards (Davis et al., 1989). The relationship between PU and BI is based on the idea that people are willing to perform the actions they believe will improve their business performances regardless of their positive or negative feelings toward the action (Davis et al., 1989).
Figure 1
Technology Acceptance Model
*Note. From “User acceptance of computer technology: A comparison of two theoretical models,” by F. D. Davis, R. P. Bagozzi, and P. R Warshaw, Management Science, 35(8), p. 985 (http://www.jstor.org/stable/2632151). Copyright 1989 by The Institute of Management Sciences.
The TAM is widely used to predict the extent to which new technologies will be adopted in ODL practices, as in many areas. In the studies about technology adoption in the literature, various technologies were discussed in terms of both students and teachers. Learning management systems (e.g., Fathema et al., 2015), mobile learning (e.g., Iqbal & Bhatti, 2015), synchronous learning (e.g., Kang & Shin, 2015), Web-based learning tools (e.g., Khor, 2014), and online forums (e.g., Camarero et al., 2012) are examples of these technologies.
In order to determine the factors that affect learners’ intentions to use VL, a research model has been developed based on the basic structures of the TAM (PU, PEU, A, BI) in this study.
In this study, PU refers to the benefits that learners perceive they will obtain from a VL. PEU, on the other hand, expresses the learners’ impressions of their efforts in using or constructing the VLs.
In studies investigating the acceptance of various ODL systems, PEU has been found to be the most important determinant of learners’ acceptance of the systems. In some of these studies, it has been observed that PU and PEU affect BI through attitudes, and at the same time, PU directly affects BI (e.g., Fathema et al., 2015; Khor, 2014). In addition, it has been observed that PEU affects PU. As a result, the following hypotheses have been developed:
H1: PU is significantly and positively related to attitude.
H2: PU is significantly and positively related to BI.
H3: PEU is significantly and positively related to PU.
H4: PEU is significantly and positively related to attitude.
Attitude in this study refers to learners’ general attitudes towards VL. Attitude is considered to be an important component in predicting behaviours. The following hypothesis has been developed:
H5: There is a significant and positive relationship between attitude and learners’ intentions.
BI refers to a person’s future intention and willingness to act. In this study, BI was expressed in terms of the intentions of learners to use VLs in other lessons and to recommend VLs to fellow students. Perceived usage (U) is the belief to what extent learners used VL. Because this study aims to discover the factors that affect learners’ intentions to use VL, BI was considered as an output variable.
In contrast to the original TAMs, for which actual use is predicted by intention, this study was added to the research model as a potential predictor of intentions to use VL. The following hypothesis was developed:
H6: U is significantly and positively related to BI.
Davis et al. also suggest that external factors may be important determinants of the PU and PEU of TAM. Numerous studies suggest various external variables for TAM (e.g., Abdullah & Ward, 2016). The initial research model is shown in Figure 2.
Figure 2
Initial Research Model
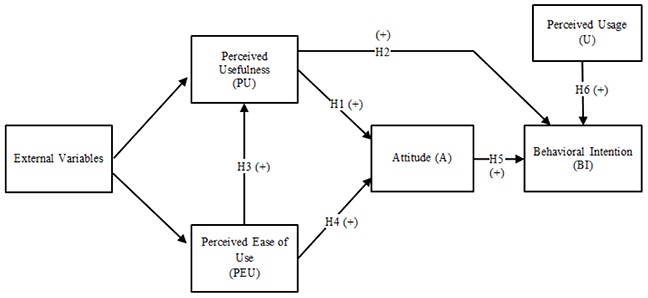
*Note. Adapted from “User acceptance of computer technology: A comparison of two theoretical models,” by F. D. Davis, R. P. Bagozzi, and P. R Warshaw, Management Science, 35(8), p. 985 (http://www.jstor.org/stable/2632151). Copyright 1989 by The Institute of Management Sciences.
This study uses an exploratory sequential mixed methods design. In the qualitative phase of the study, semi-structured interviews were conducted with 15 students who performed experiments in a VL in order to find the important factors affecting students’ VL usage behaviour and views about the VL.
Based on qualitative findings, to increase the model’s predictive power, various external variables that can affect PU and PEU were added to this initial research model, and a final research model was established. The quantitative phase of the study was then conducted to verify causal relationships.
In this study, an exploratory sequential mixed method design was used. Exploratory sequential design consists of two stages in which researchers qualitatively explore a subject and conduct quantitative research to generalize these qualitative findings to larger samples (Creswell, 2012). In this study, first, a qualitative case study was carried out, and then the quantitative phase was conducted. These two consecutive phases can be described as content analysis and survey.
In the Open Education Faculty at Anadolu University, for applied courses, learners come to campus for a certain period in the summer and practise in a real laboratory environment under instructors’ supervision. One of those courses is Circuit Analysis. Learners are invited from various provinces of Turkey to the campus for face-to-face laboratory practices for a duration time. They are provided with an application guide and also experimental videos to prepare for laboratory applications. In this study, circuit analysis virtual laboratories (CAVL), which enable learners to carry out virtual applications, were presented to learners through e-learning environments in the scope of the Circuit Analysis Laboratory course.
This study consists of a four-stage process. The first stage concerns the design of the course’s e-learning environment. An e-learning environment has been developed by screening the relevant literature, examining sample lessons and VLs, and taking expert opinions, and it has been made available to learners through an open source learning management system (LMS). In this stage, the use of an open source, two-dimensional (2D) PhET circuit construction kit was deemed appropriate to enable laboratory applications to be carried out in a virtual environment.
In the second stage, the qualitative data was collected and analyzed. In the third stage, a research model was developed in light of qualitative findings, and a measurement tool was developed. In addition, readjustments were made in the e-learning environment, taking the students’ recommondations into account. During this stage, a three-dimensional (3D) VL with a realistic representation of the materials and processes used in circuit analysis experiments, as well as 2D VL, was shared with the learners. In the fourth stage, quantitative data was collected, analyzed, and interpreted. The stages of the research process is shown in Figure 3.
Figure 3
Stages of the Research Application Process
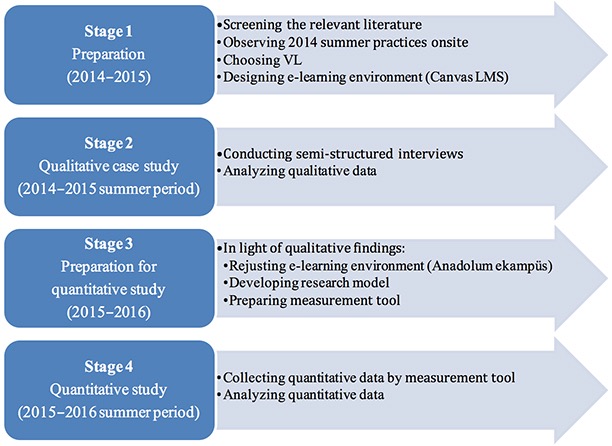
*Note. VL = virtual laboratory; LMS = learning management system.
The research was conducted with two different groups for the qualitative case study and quantitative research phases of the study.
The qualitative case study phase of the study was planned for 1,062 learners who had enrolled in the summer semester of the 2014-2015 academic year. The e-learning environment (Canvas LMS) was introduced to the learners before their session appointments. LMS records show that 296 learners used this environment, but only 60 of those learners performed experiments in CAVL.
In this study, the criterion sampling, which is a purposeful sampling method, was used to gather the opinions of learners about the VL. The basic criterion was to include only learners who had conducted at least one experiment in CAVL. In accordance with this basic criterion, the qualitative case study participants constituted 15 learners who voluntarily performed experiments in the CAVL (Table 1).
Table 1
Qualitative Case Study Participants
| Date | Participant | Age | Gender | Working status | Education level |
| June 22-26, 2015 | P1 | 40 | Male | Working | Undergraduate |
| P2 | 50 | Male | Working | Undergraduate | |
| P3 | 32 | Male | Working | Undergraduate | |
| July 6-10, 2015 | P4 | 36 | Male | Working | High school |
| P5 | 33 | Male | Working | Undergraduate | |
| P6 | 44 | Female | Working | Undergraduate | |
| July 20-24, 2015 | P7 | 26 | Male | Working | High school |
| P8 | 23 | Female | Working | High school | |
| P9 | 28 | Male | Working | High school | |
| July 27-31, 2015 | P10 | 27 | Male | Working | High school |
| P11 | 21 | Female | Student | High school | |
| P12 | 42 | Male | Working | Undergraduate | |
| P13 | 29 | Male | Working | Associate degree | |
| P14 | 25 | Male | Student | Undergraduate | |
| August 3-7, 2015 | P15 | 52 | Female | Not working | Undergraduate |
The quantitative phase of the work was planned for 1,370 learners who had registered for the summer session of the 2015-2016 academic year. The prepared e-learning platform (Anadolum ekampüs) was introduced to these learners before their appointment date. During the summer period, the survey tool was shared online with learners. A total of 49 responded to the survey (Table 2).
Table 2
Quantitative Research Participants
| Demographic characteristics | Frequency | % | |
| Gender | Male | 45 | 91.84 |
| Female | 4 | 8.16 | |
| Age | 20-29 | 19 | 38.76 |
| 30-39 | 19 | 38.76 | |
| 40-49 | 10 | 20.41 | |
| 50+ | 1 | 2.04 | |
| Education level | High school | 17 | 34.69 |
| Associate degree | 5 | 10.20 | |
| Undergraduate | 24 | 48.98 | |
| Postgraduate | 3 | 6.21 | |
| Working status | Working | 40 | 81.63 |
| Not working | 9 | 18.37 | |
Qualitative data was collected using a semi-structured interview technique. The interview form was used as a data collection tool. This form was prepared based on the constructs important for understanding the VL’s ease of use, usefulness, participants’ behavioural intention to use, and participants’ general views of the VL. This interview form was presented to experts for their opinions, and the questions were examined in terms of their clarity and language. Necessary adjustments were made in line with the experts’ recommendations.
To determine the factors that affect CAVL users’ intentions, the researchers developed a research model in the light of qualitative case study findings and created a measurement tool within this model. In the first part of the scale, demographic information was collected from learners. In the second part, the learners’ experiences about CAVL were investigated within the framework of the research model. The developed scale consists of 11 variables and 29 items in total. The scale items were prepared to cover all of the subthemes obtained as a result of semi-structured interviews. While some scale items were adapted from previous studies in the literature, others were developed by the researchers. A seven-point Likert scale was used to assess the items in the measurement tools.
Individual interview data with learners were analyzed using the content analysis method. The recorded interviews were first transcribed to writing and saved on a computer. The researchers and an area specialist later coded this recorded data and determined the subthemes and main themes related to these codes. Content analysis results were tabulated and given as frequency and percentage values.
Partial least squares (PLS) structural equation modelling (SEM) was used to analyze the quantitative data. The SmartPLS 3.0 (student edition) program (Ringle et al., 2015) was used for PLS-SEM. PLS-SEM was used in this study for reasons such as a low number of samples and its strong prediction accuracy of PLS. According to Hair et al. (2011), the minimum sample size for testing PLS-SEM models is 10 times the largest number of structural paths directed at a particular latent construct in the structural model.
Because there are at most four structural paths for a latent structure in the developed research model, 40 samples were sufficient for this study. There are 49 samples in this study, so the minimum sampling requirement of PLS analysis was met.
In this study, where a semi-structured interview technique was used to determine the learners’ opinions about their experiences with the VL, the results obtained were analyzed in-depth, and themes and subthemes were created. Table 3 shows the frequency and percentage distribution of learners’ views according to these themes.
Table 3
Themes and Subthemes
| Theme | Subtheme | Frequency | % |
| Technological factors | Installation | 7 | 26.92 |
| Usage | 8 | 30.77 | |
| Functionality | 5 | 19.23 | |
| Visuality | 6 | 23.01 | |
| TOTAL | 26 | 100.00 | |
| Educational factors | Preparation | 13 | 35.13 |
| Preparation time | 5 | 13.51 | |
| Theoretical knowledge development | 10 | 27.03 | |
| Relative advantage | 7 | 18.92 | |
| Academic support | 2 | 5.41 | |
| TOTAL | 37 | 100.00 | |
| Affective factors | Satisfaction | 10 | 62.50 |
| Motivation | 4 | 25.00 | |
| Self-efficacy | 2 | 12.50 | |
| TOTAL | 16 | 100.00 |
Installation. It was determined that learners evaluated CAVL differently from the standpoint of installation. While some indicated that they did not have any problems with installation, others did report having difficulties. Installing CAVL requires basic computer skills. Although some of the learners had difficulties, all of them were able to conduct experiments by setting up the CAVL. This can be explained by short training videos and documentation on CAVL setup that are available in the LMS. In addition, one learner said that CAVL would be more accessible if it were presented directly online in the absence of third-party software.
Usage. Learners stated that they were able to carry out experiments in CAVL without any major problems. This can be explained by the fact that the CAVL is user-friendly and has a simple interface and detailed guidelines for experiments. The learners also said that the guidelines for the experiments were explanatory, and it was easy to carry out experiments.
Functionality and Visuality. When the CAVL was selected, the circuits and equipment used in circuit analysis were taken into consideration. The purpose of CAVL is not to provide a visually realistic experimental environment but rather to help learners understand the electrical behaviours underlying the circuits established. However, learners have stated that there is a visual and functional difference between the environment and equipment used in the CAVL and those in the actual laboratory and that the CAVL should be further developed.
Preparation. Most learners in this study stated that they became more conscious of the face-to-face laboratory environment with CAVL, and it allowed them to better prepare for a face-to-face laboratory setting, experiment materials, and correct use of materials. This was an advantage for those who used CAVL compared with those who did not use CAVL.
Preparation Time. Learners stated that they could not benefit from the CAVL as much as possible and could not finish the experiments on time, indicating that there was not enough time between the announcement date and the face-to-face laboratory session dates or that they could not spare time from their work.
Theoretical Knowledge Development. Most learners stated that CAVL helped improve their theoretical knowledge by providing visual learning opportunities. They stated that they had found the opportunity to learn by doing in CAVL, which made it easier for them to structure their knowledge in this regard and make it more permanent.
Relative Advantage. Some learners pointed out that using CAVL together with the application books and videos provided by the institution was more productive than using these environments alone.
Academic Support. In interviews, some learners requested the development of an interactive system in order to receive immediate support for problems and errors encountered during the execution of experiments.
Satisfaction. Most learners stated that they perceived CAVL as a positive experience, were satisfied with the environment, and found the system successful. Some learners also hoped to have such a system for other laboratory courses.
Motivation. In the interviews, some learners stated that they were motivated by the the institution’s encouragement in using CAVL and the extra scores they received after conducting experiments in CAVL. The learners who expressed their views on this issue requested that the use of CAVL be made compulsory and that it would always contribute to scores; thus, other learners would be more likely to be willing to use CAVL.
Self-Efficacy. Some learners’ self-efficacy within the scope of the circuit analysis subject was influential to their perceptions of using CAVL. One learner stated that he felt the need to use CAVL because he had been seeing himself as inadequate in circuit analysis. On the other hand, a learner with high self-efficacy for circuit analysis said that it was easy to use CAVL. The familiarity of the materials used in circuit analysis allowed the experiments to be carried out more conveniently in CAVL.
Interviews with the learners highlighted the need for improvements regarding an LMS and VLs. Canvas LMS, which was used for this study, is a platform independent from the Open Education Faculty’s official system. The existence of these two platforms is observed as the cause of the troubles since students have to log in to these platforms located at different web addresses with a different username and password. The prepared environment has been moved to the official e-campus platform. It was shared at the beginning of the semester so that learners could find more time to prepare for the face-to-face laboratory environment. In addition, during the quantitative research phase, a 3D CAVL containing a realistic representation of the equipment and processes was also shared with the learners. Unlike the 2D CAVL, the 3D CAVL works online via a browser. A telephone hotline was also shared so learners could get immediate help and support in academic and technical matters.
To determine the factors that affect learners’ intentions to use a VL, a final research model has been developed as a result of qualitative case study findings and a literature review. The model is based on the basic structures of the TAM. Qualitative findings have been helpful in determining the factors that influence learners’ intentions to use a VL. With semi-structured interviews, the important factors in using a VL have been identified. For example, learners often find VLs useful in a variety of ways, and their experience with installation and use is often mentioned. This confirms that PU and PEU are important factors affecting learners’ attitudes and intentions to use technology, as noted in other technology adoption studies (Fathema et al., 2015; Khor, 2014). Other factors that emerged as a result of the interviews are relative advantage, motivation, support, self-efficacy, and visuality/functionality. The self-efficacy factor in the research model proposed in this study is addressed in two ways. The first is circuit analysis self-efficacy (CASE) and the second is VL self-efficacy (VLSE). While CASE emerged as a factor affecting learners’ use of VL as a result of the interviews, VLSE was modelled by the researchers by considering the difficulties that learners experienced in installing and using CAVL. The visuality/functionality factor was considered within system characteristics (SC) in the model. The final research model is shown in Figure 4.
Figure 4
Final Research Model
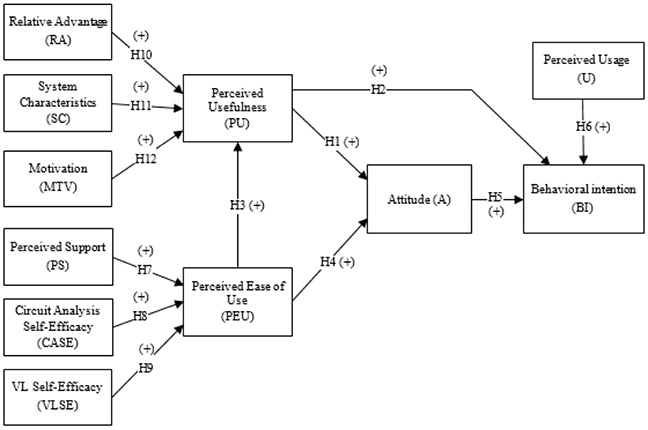
Perceived Support (PS). In this study, PS refers to the perceptions of learners about the availability of the resources they need during their VL use. As a result of the qualitative case study, it has been found that learners need support.
H7: PS is significantly and positively related to PEU.
Self-Efficacy Perception. In this study, self-efficacy perception was approached from two viewpoints. The first is self-efficacy perceptions for learners using VL (VLSE), and the other is self-efficacy perceptions about being able to perform experiments in the real-time circuit analysis laboratory (CASE). The following hypotheses have been developed as a result of the qualitative case study findings and literature review:
H8: CASE is significantly and positively related to PEU.
H9: VLSE is significantly and positively related to PEU.
Relative Advantage (RA). In this study, RA is considered as a reflection of the advantages of using VLs together with other existing materials (books, videos, etc.).
H10: RA is significantly and positively related to PU.
System Characteristics (SC). SC can be defined as features that enable a system to perform its task in the best way in accordance with the desired purposes (Venkatesh & Davis, 2000). In this study, SC was defined as learners’ perception that a VL is similar to a real laboratory environment and the extent to which they can perform experiments that would be done in the real laboratory environment in a VL. In this study, a VL was used as a supportive material to prepare for the face-to-face laboratory environment. Therefore, SC is thought to only affect PU.
H11: SC is significantly and positively related to PU.
Motivation (MTV). In this study, motivation refers to the use of VL by learners to achieve their goals or as a result of the instruction of the teaching institution. Motivation is thought to affect only PU.
H12: MTV is significantly and positively related to PU.
Quantitative analysis was performed in two steps. First, the measurement model was evaluated. Then, the hypothesis was tested and the structural model was estimated.
Prior to analyzing the structural model, the validity and reliability of the measurement model must be analyzed. For this purpose, indicator reliability, internal consistency, convergent validity, and discriminant validity were examined in order.
The item loadings are shown in Table 4. If these values are 0.7 or higher, they are considered satisfactory, and if higher than 0.5, they are considered acceptable (Chin, 1998). In this study, the threshold value for item loadings was 0.5, and indicators below this value were deleted. As shown in Table 4, the loads of all the items in the measurement model are between 0.600 and 0.966, which indicates sufficient item reliability.
Table 4
Partial Least Squares Results of the Measurement Mode l
| Variable | Indicator | Item loading | M | SD | Composite reliability | AVE |
| PEU | peu1 | 0.853 | 4.939 | 1.8530 | 0.872 | 0.774 |
| peu2 | 0.906 | 5.184 | 1.6030 | |||
| PU | pu1 | 0.802 | 5.347 | 1.7506 | 0.893 | 0.737 |
| pu2 | 0.881 | 5.612 | 1.6178 | |||
| pu3 | 0.889 | 4.816 | 1.9650 | |||
| PS | ps1 | 0.767 | 5.388 | 1.8576 | 0.841 | 0.571 |
| ps2 | 0.652 | 4.367 | 1.9968 | |||
| ps3 | 0.804 | 4.102 | 2.0941 | |||
| ps4 | 0.788 | 4.061 | 2.1056 | |||
| SC | sc1 | 0.855 | 5.122 | 1.5361 | 0.843 | 0.643 |
| sc2 | 0.813 | 4.980 | 1.4360 | |||
| sc3 | 0.733 | 5.143 | 1.6708 | |||
| RA | ra1 | 0.873 | 5.429 | 1.7795 | 0.894 | 0.808 |
| ra2 | 0.925 | 5.857 | 1.4142 | |||
| MTV | mtv1 | 0.958 | 5.041 | 1.9035 | 0.873 | 0.705 |
| mtv2 | 0.914 | 4.980 | 1.9737 | |||
| mtv3 | 0.600 | 5.143 | 1.7200 | |||
| CASE | case1 | 0.958 | 5.408 | 1.6447 | 0.947 | 0.857 |
| case2 | 0.966 | 5.408 | 1.6320 | |||
| case3 | 0.848 | 5.571 | 1.5138 | |||
| VLSE | vlse1 | 0.765 | 6.163 | 1.3126 | 0.840 | 0.727 |
| vlse2 | 0.932 | 4.918 | 1.7776 | |||
| U | u | 1.000 | 3.306 | 1.7225 | 1.000 | 1.000 |
| A | a1 | 0.831 | 5.245 | 1.7384 | 0.754 | 0.607 |
| a2 | 0.723 | 5.755 | 1.8204 | |||
| BI | bi1 | 0.914 | 5.510 | 1.6089 | 0.911 | 0.836 |
| bi2 | 0.914 | 5.490 | 1.5562 |
*Note. AVE = average variance extracted; PEU = perceived ease of use; PU = perceived usefulness; PS = perceived support; SC = system characteristics; RA = relative advantage; MTV = motivation; CASE = circuit analysis self-efficacy; VLSE = virtual laboratories self-efficacy; U = percieved usage; A = attitude; BI = behavioural intention.
Composite reliability was calculated for internal consistency. Hair et al. (2012) indicate that the composite reliability value should be 0.70 or higher, but values of 0.60 or higher are acceptable values for an exploratory study. Table 4 shows the composite reliability values of the variables. These values are higher than the threshold value of 0.70 for all variables. This means that the variables have high internal consistency.
The average variance extracted (AVE) value of each variable was calculated for convergent validity. Fornell and Larcker (1981) state that the acceptable value of AVE should be 0.50 or higher. In Table 4, it is shown that the AVE values obtained for each of the variables are higher than the 0.50 threshold value, which shows the appropriate convergence validity.
The square root of the AVE value of each variable is highly correlated with the other latent variables, which indicate the discriminant validity of the model (Fornell & Larcker, 1981). The square root of the AVE values calculated from each variable are larger than the correlation values with the other variables and this criterion is satisfied, as seen in Table 5.
Table 5
Discriminant Validity
| PS | PU | U | PEU | CASE | BI | RA | MTV | SC | VLSE | A | |
| PS | 0.755 | ||||||||||
| PU | 0.627 | 0.858 | |||||||||
| U | 0.264 | 0.237 | Single Item | ||||||||
| PEU | 0.527 | 0.596 | 0.209 | 0.880 | |||||||
| CASE | 0.346 | 0.381 | 0.147 | 0.585 | 0.926 | ||||||
| BI | 0.531 | 0.839 | 0.212 | 0.516 | 0.377 | 0.914 | |||||
| RA | 0.478 | 0.838 | 0.212 | 0.351 | 0.312 | 0.812 | 0.899 | ||||
| MTV | 0.505 | 0.838 | 0.258 | 0.416 | 0.385 | 0.705 | 0.796 | 0.839 | |||
| SC | 0.710 | 0.769 | 0.184 | 0.740 | 0.512 | 0.715 | 0.610 | 0.567 | 0.802 | ||
| VLSE | 0.388 | 0.367 | 0.356 | 0.661 | 0.575 | 0.170 | 0.170 | 0.357 | 0.438 | 0.852 | |
| A | 0.417 | 0.762 | 0.350 | 0.523 | 0.427 | 0.758 | 0.629 | 0.654 | 0.680 | 0.381 | 0.779 |
*Note. PS = perceived support; PU = perceived usefulness; U = percieved usage; PEU = perceived ease of use; CASE = circuit analysis self-efficacy; BI = behavioural intention; RA = relative advantage; MTV = motivation; SC = system characteristics; VLSE = virtual laboratories self-efficacy; A = attitude.
The square roots of the AVE values are presented diagonally.
The results in Table 5 show the validity and reliability of the measurement model, which are prerequisites for evaluating the structural model and hypothesis testing.
Following the evaluation of the measurement model, the structural model was tested, and the causal links identified in the proposed research model were examined. The coefficient of determination (r2) for each dependent variable (endogenous variables) and path coefficients (β) were obtained in the model using the PLS-SEM method.
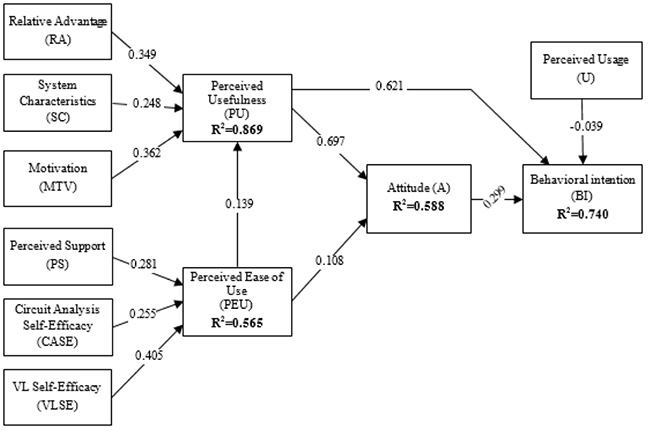
The coefficient of determination (r2) indicates the percentage of the model’s dependent structure is exposed by independent (exogenous) structures. In the PLS method, values of 0.67, 0.33, and 0.19 r2 are defined as strong, moderate, and weak, respectively (Chin, 1998). Table 6 gives the r2 values of the endogenous variables. In the proposed model, 86.9% of learners’ beliefs that VLs are useful (PU), 56.5% of learners’ beliefs that they can easily carry out their experiments in VLs without effort (PEU), 74% of learners’ future intentions to use VLs (BI), and 58.8% of learners’ attitudes towards VL (A) are explained by other variables affecting these variables. The r2 values obtained for PU and BI are strong, and the r2 values obtained for PEU and A have moderate values. This suggests that the proposed model is quite successful at explaining learners’ intentions to use a VL.
Table 6
Variance Explanation Results
| Variable | r2 |
| PU | 0.869 |
| PEU | 0.565 |
| BI | 0.740 |
| A | 0.588 |
*Note. r2 = coefficient of determination; PU = perceived usefulness; PEU = perceived ease of use; BI = behavioural intention; A = attitude.
The path coefficients (β) indicate the magnitude of the causal relation between the constructs, that is, the magnitude of effect of one variable on the other. For the model proposed, the path coefficients (between the arrows) and the r2 values (in the boxes) are shown in Figure 5. For example, it can be said that the effect of PU on BI (β = 0.621) is strong, A (β = 0.299) is moderate, and U (β = -0.039) is very weak. The path coefficients in the model are found to be positive except for the path coefficient between U and BI. A negative path coefficient indicates that the causal relation is negative.
Figure 5
Partial Least Squares Analysis Results
The bootstrap method was used to estimate the statistical significance of the path coefficients in the model, and t statistics and standard errors were produced. Hypotheses were tested using the t values. In this study, the bootstrap analysis was performed with 500 subsamples. Figure 6 displays a graphical representation of the bootstrap output along with the t values.
Figure 6
Bootstrap Output With t Values

*Note. One-tailed *p < .05. **p < .01. ***p < .001.
Table 7 summarizes the hypothesis results; 9 of the 12 hypotheses are supported. All hypotheses related to TAM variables (H1, H2, H3, H5) were supported except for the causal relation between PEU and A (H4). In addition, the effect of U on BI was not significant (H6) (t = 0.446; p > .05).
Table 7
Summary of Hypotheses Results
| Hypothesis | Path coefficients | t | Result | |
| H1 | PU → A | 0.697 | 4.673*** | Supported |
| H2 | PU → BI | 0.621 | 4.309*** | Supported |
| H3 | PEU → PU | 0.139 | 1.701* | Supported |
| H4 | PEU → A | 0.108 | 0.650 | Not supported |
| H5 | A → BI | 0.299 | 1.700* | Supported |
| H6 | U → BI | -0.039 | 0.446 | Not supported |
| H7 | PS → PEU | 0.281 | 2.477** | Supported |
| H8 | CASE → PEU | 0.255 | 1.427 | Not supported |
| H9 | VLSE → PEU | 0.405 | 2.268* | Supported |
| H10 | RA → PU | 0.349 | 2.662** | Supported |
| H11 | SC → PU | 0.248 | 2.018* | Supported |
| H12 | MTV → PU | 0.362 | 3.707*** | Supported |
*Note. PU = perceived usefulness; A = attitude; BI = behavioural intention; PEU = perceived ease of use; U = percieved usage; PS = perceived support; CASE = circuit analysis self-efficacy; VLSE = virtual laboratories self-efficacy; RA = relative advantage; SC = system characteristics; MTV = motivation.
One-tailed *p < .05. **p < .01. ***p < .001.
The effect size (f2) measures how the value of r2 changes when a variable is subtracted from the model. In other words, the subtracted exogenous variable is used to evaluate whether it has an effect on the r2 value of the endogenous structure. Effect sizes of 0.02, 0.15, and 0.35 mean small, medium, and large influences, respectively (Cohen, 1988). Table 8 shows the effect size results for each variable. In the production of the r2 value of the BI variable, it is seen that the effect of PU is large, A is small, and PEU is small. In the production t2 value of the PU variable, the effects of learners’ motivation to use the virtual lab (MTV), the advantages of using VLs together with other existing materials (RA), and learners’ perceptions of virtual labs to resemble real lab environments (SC) are moderate, and PEU is small. In the production r2 value of the PEU variable, self-efficacy perceptions (VLSE) for learners using VL (VLSE) and perceptions of learners about the availability of the resources they need during their VL use (PS) has a moderate effect, and self-efficacy perceptions about being able to perform experiments in the real-time VL (CASE) has a small effect. If r2 of the variable A is produced, the PU has a large effect, while the PEU has a small effect.
Table 8
Effect Size Results
| f2 | |
| Behavioural intention | |
| PU | 0.621 |
| U | 0.005 |
| A | 0.133 |
| Perceived usefulness | |
| PEU | 0.062 |
| RA | 0.287 |
| MTV | 0.345 |
| SC | 0.147 |
| Perceived ease of use | |
| PS | 0.150 |
| CASE | 0.097 |
| VLSE | 0.237 |
| Attitude | |
| PU | 0.761 |
| PEU | 0.018 |
*Note. PU = perceived usefulness; U = percieved usage; A = attitude; PEU = perceived ease of use; RA = relative advantage; MTV = motivation; SC = system characteristics; PS = perceived support; CASE = circuit analysis self-efficacy; VLSE = virtual laboratories self-efficacy.
Factors affecting learners’ intention to use a VL in this study were determined within the framework of the research model built on the basic components of the TAM as a result of qualitative case study findings and literature review. Most of the causal relations between the developed model variables were supported. The results of the study confirmed 9 out of 12 hypotheses (Figure 7). Therefore, it can be said that the model is a useful theoretical model in terms of helping understand and explain learners’ intentions of using a VL.
Figure 7
Results of Research Model
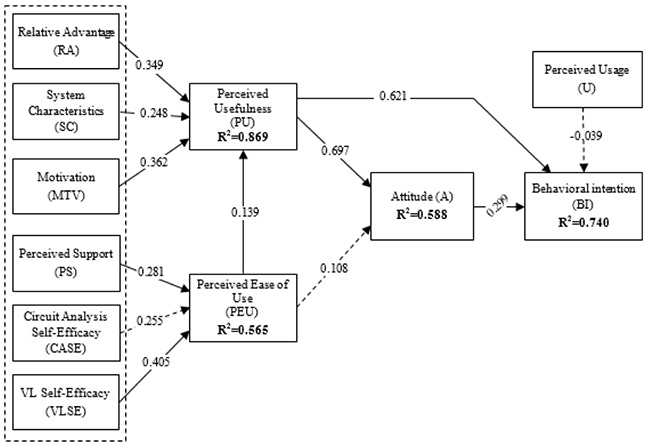
*Note. Straight arrows indicate supported hypotheses and dashed arrows indicate unsupported hypotheses.
The strongest direct influence on learners’ intention to use a VL was the variable PU. Learners will use a VL more often if they think that it is useful in situations such as preparing for a face-to-face lab environment, getting to know circuit components, or improving performance in experiments conducted in face-to-face labs. The results also show that learners’ attitudes have a positive influence on BI. That is, learners are more likely to use a VL when they have positive feelings towards VL use. Finally, the U variable apparently has no significant effect on learners’ attitudes.
Only PU had a significant effect in determining the attitudes of learners in this study. Although PEU is one of the main building blocks of the TAM, it does not have an observable direct influence on learners’ attitudes. Thus, we can conclude that benefits of VLs are important in learners’ attitudes towards VLs but that perceptions of how easy or difficult VLs are to use are not important. Despite the fact that the relationship between PEU and A is not significant in this study contradicts the TAM; other studies have found similar results (e.g., Camarero et al., 2012; Sun & Cheng, 2009; Tan, 2015).
In this study, PU and PEU mediate the relationship between external factors and learners’ attitudes towards a VL and their intentions to use it.
A significant and positive correlation was found between the PEU, RA, MTV, and SC variables and PU, and 86.9% of the variance in PU could be explained by these variables. As a result, learners with high motivation who think that the use of VL is clear, easy, and understandable; that experiments can be performed like in a real laboratory; and that VL is complementary to existing learning materials will have a positive conception on the gains of VL. Therefore, their attitudes towards using VL will be positive, and their intent to use it will increase. This finding guides developers, designers, and institutions in carefully assessing the needs of learners so that they, in turn, can be effectively met by a VL.
Finally, PS, VLSE, and CASE variables account for 56.5% of the variance in PEU. Support provided to learners on technical and academic matters will influence their belief that they can easily carry out experiments in a VL without effort. Learners may think that a VL is a difficult and complicated technology because of the problems they are experiencing because they lack a theoretical guide in setting it up. Designers and institutions therefore must offer more help and support services so that learners can solve their potential problems with VLs. In this way, learners will learn more about VLs and experiments through support, and the perception of the ease of use of VLs will be positive.
On the other hand, VLSE seems to have a strong influence on PEU. Learners with self-efficacy in the use of a VL will find the VL easier to use than other learners, as their tendency to resolve problems with the VL by themselves via their own efforts will be higher. However, learners’ self-efficacy on the subject of circuit analysis seems to have no effect on PEU. The hypothesis that there would be a positive correlation between PEU and CASE, which emerged as a result of qualitative interviews and which resulted in the tendency of learners with self-efficacy in circuit analysis to perceive the use of VL more easily, was not confirmed.
It is important for institutions, developers, and designers to investigate the factors that affect the use of VLs. This study demonstrates that the proposed model can be used as a useful theoretical framework to predict and understand the factors that affect learners’ intentions to use a VL.
A model was developed in this study to understand the intentions of learners in using a VL. Undoubtedly, creating a conceptual framework on this subject with a single study is difficult. Therefore, in future studies, this model can be evaluated by various users in similar or different contexts. Studies can be done to increase the explanatory rate by exploring different variables that may have an effect on learners’ VL use and adding them to the model. In addition, the influence of demographic characteristics such as age, gender, and experience on learners’ VL acceptance can be examined.
Abdullah, F., & Ward, R. (2016). Developing a general extended technology acceptance model for e-learning (GETAMEL) by analysing commonly used external factors. Computers in Human Behavior, 56, 238-256. https://doi.org/10.1016/j.chb.2015.11.036
Camarero, C., Rodríguez, J., & José, R. S. (2012). An exploratory study of online forums as a collaborative learning tool. Online Information Review, 36(4), 568-586. https://doi.org/10.1108/14684521211254077
Chin, W. W. (1998). The partial least squares approach to structural equation modeling. In G. A. Marcoulides (Ed.), Modern methods for business research (pp. 295-336). Lawrence Erlbaum Associates Publishers.
Cohen, J. (1988). Statistical power analysis for the behavioral sciences (2nd ed.). Routledge.
Creswell, J. W. (2012). Educational research: Planning, conducting, and evaluating quantitative and qualitative research (4th ed.). Pearson.
Dalgarno, B. (2002). The potential of 3D virtual learning environments: A constructivist analysis. Electronic Journal of Instructional Science and Technology, 5(2), 1-19. https://researchoutput.csu.edu.au/en/publications/the-potential-of-3d-virtual-learning-environments-a-constructivis
Davis, F. D., Bagozzi, R. P., & Warshaw, P. R. (1989). User acceptance of computer technology: A comparison of two theoretical models. Management Science, 35(8), 982-1003. http://www.jstor.org/stable/2632151
Fathema, N., Shannon, D., & Ross, M. (2015). Expanding the technology acceptance model (TAM) to examine faculty use of learning management systems (LMSs) in higher education institutions. MERLOT Journal of Online Learning and Teaching, 11(2), 210-232. https://www.merlot.org/merlot/viewMaterial.htm?id=1053019
Fornell, C., & Larcker, D. F. (1981). Structural equation models with unobservable variables and measurement error: Algebra and atatistics. Journal of Marketing Research, 18(3), 382-388. https://doi.org/10.1177/002224378101800313
Hair, J. F., Ringle, C. M., & Sarstedt, M. (2011). PLS-SEM: Indeed a silver bullet. Journal of Marketing Theory and Practice, 19(2), 139-152. https://doi.org/10.2753/MTP1069-6679190202
Hair, J. F., Sarstedt, M., Ringle, C. M., & Mena, J. A. (2012). An assessment of the use of partial least squares structural equation modeling in marketing research. Journal of the Academy of Marketing Science, 40(3), 414-433. https://doi.org/10.1007/s11747-011-0261-6
Hofstein, A., & Lunetta, V. N. (1982). The role of the laboratory in science teaching: Neglected aspects of research. Review of Educational Research, 52(2), 201-217. https://doi.org/10.2307/1170311
Hung, J. F., & Tsai, C. Y. (2020). The effects of a virtual laboratory and meta-cognitive scaffolding on students’ data modeling competences. Journal of Baltic Science Education, 19(6), 923-939. https://doi.org/10.33225/jbse/20.19.923
Iqbal, S., & Bhatti, Z. A. (2015). An investigation of university student readiness towards M-learning using technology acceptance model. International Review of Research in Open and Distributed Learning, 16(4). https://doi.org/10.19173/irrodl.v16i4.2351
Kang, M., & Shin, W. S. (2015). An empirical investigation of student acceptance of synchronous e-learning in an online university. Journal of Educational Computing Research, 52(4), 475-495. https://doi.org/10.1177/0735633115571921
Kennepohl, D. K. (2013). Learning from blended chemistry laboratories. In K. S. Iyer (Ed.), 2013 IEEE Fifth International Conference on Technology for Education (pp. 135-138). https://doi.org/10.1109/T4E.2013.40
Kennepohl, D. K. (2017). Providing effective teaching laboratories at an open university. International Journal on Innovations in Online Education, 1(4). https://doi.org/10.1615/IntJInnovOnlineEdu.2017021513
Khor, E. T. (2014). An analysis of ODL student perception and adoption behavior using the technology acceptance model. International Review of Research in Open and Distance Learning, 15(6), 275-288.
Meester, M. A. M., & Kirschner, P. A. (1995). Practical work at the Open University of the Netherlands. Journal of Science Education and Technology, 4(2), 127-140. https://doi.org/10.1007/BF02214053
Ringle, C. M., Wende, S., & Becker, J.-M. (2015). SmartPLS (Version 3) [Computer software]. SmartPLS. http://www.smartpls.com
Stefanovic, M. (2013). The objectives, architectures and effects of distance learning laboratories for industrial engineering education. Computers & Education, 69, 250-262. https://doi.org/10.1016/j.compedu.2013.07.011
Sun, H. M., & Cheng, W. L. (2009). The input-interface of webcam applied in 3D virtual reality systems. Computers & Education, 53(4), 1231-1240. https://doi.org/10.1016/j.compedu.2009.06.006
Tan, P. J. B. (2015). English e-learning in the virtual classroom and the factors that influence ESL (English as a second language): Taiwanese citizens’ acceptance and use of the modular object-oriented dynamic learning environment. Social Science Information, 54(2), 211-228. https://doi.org/10.1177/0539018414566670
Venkatesh, V., & Davis, F. D. (2000). A theoretical extension of the technology acceptance model: Four longitudinal field studies. Management Science, 46(2), 186-204. https://www.jstor.org/stable/2634758
Wolski, R., & Jagodzinski, P. (2019). Virtual laboratory—Using a hand movement recognition system to improve the quality of chemical education. British Journal of Educational Technology, 50(1), 218-231. https://doi.org/10.1111/bjet.12563

Investigation of the Factors Affecting Open and Distance Education Learners' Intentions to Use a Virtual Laboratory by Hanife Çivril and Ali Ekrem Özkul is licensed under a Creative Commons Attribution 4.0 International License.