Volume 23, Number 1
Yung-Hsiang Hu
National Yunlin University of Science and Technology
Early warning systems (EWSs) have been successfully used in online classes, especially in massive open online courses, where it is nearly impossible for students to interact face-to-face with their teachers. Although teachers in higher education institutions typically have smaller class sizes, they also face the challenge of being unable to have direct contact with their students during distance teaching. In this research, we examined the online learning trajectories of students participating in four small private online courses that were all taught by one teacher. We collected relevant data of 1,307 students from the campus learning management system. Subsequently, we constructed 18 prediction models, one for each week of the course, to develop an EWS for identifying students in online asynchronous learning at risk of failing (i.e., students who fail their final examination). Our results indicated that the fifth-week model successfully predicted student performance, with an accuracy exceeding 83% from the eighth week onward.
Keywords: precision education, SPOC, early warning system, portability of prediction model, LMS
Learning management systems (LMSs) are used to quantify the learning behavior of students, enabling teachers to obtain data that are unavailable through face-to-face teaching in physical classrooms. Teachers can model or predict students’ behaviors by using data mining or analysis (Papamitsiou & Economides, 2014). Massive open online courses (MOOCs) are particularly suitable for learning analytics or building prediction models because they involve the accumulation of large amounts of student data, which is helpful for the early detection of students who may be unable to complete such an online course (He et al., 2015) or for predicting academic results (Li et al., 2017). An early warning system (EWS) for online teaching is a precision teaching tool. Institutions of higher education have achieved digital transformation through the value-added application of learning data. Teachers have consequently become adept at running online courses, which may include setting up decision support systems (Kotsiantis, 2011), conducting instructional interventions at the most appropriate time by using EWSs (Howard et al., 2018), and predicting academic failure (Costa et al., 2017). Research in this field has focused on collecting data on students who are “at risk” or “off track” and determining why they failed or ceased learning; however, studies have focused on the period following the completion of courses, which is too late to provide adequate support to these students (Hu et al., 2014). Related research has also revealed that teachers can use the LMS data of single online courses on platforms such as Moodle (Cerezo et al., 2016; Romero et al., 2008) and Blackboard (Morris et al., 2005; Tempelaar et al., 2015) to build effective predictive models as warning systems (Hu et al., 2014; Macfadyen & Dawson, 2010). However, for small private online courses (SPOCs) in universities, current empirical research has focused on how the demand for teachers to build EWSs for asynchronous distance teaching courses through small samples from SPOCs has decreased. This decline may be due to the limitations of having fewer students in a class or the convenience of face-to-face consultations between teachers and students on campus. Our review of the literature also revealed that few teachers are able to use the data from multiple courses in the LMS of their institution to successfully develop portable prediction models as warning systems. Researchers have argued that this may be due to the differences between the courses and their instructional design (Gašević et al., 2016; Macfadyen & Dawson, 2010). Even if the data learning models of various courses within an institution are designed with high prediction accuracy, substantial differences may remain in the accuracy of the models (Conijn et al., 2017; Gašević et al., 2016). Therefore, although more institutions of higher education are offering SPOCs, research analyzing the use of few-shot learning materials for developing warning systems for SPOCs remains limited. Using few-shot learning is to predict something based on a few limited training examples. Currently, teachers are facing 10%-20% higher dropout rates for online courses than for face-to-face courses (Bawa, 2016). Thus, teachers require tools to help them identify struggling students before they drop out or fail. In this study, we collected small-sample data from different courses taught by the same teacher, while the courses were running, to build a portable student learning prediction model that can act as a warning system in SPOCs. Students who are at risk can be identified by analyzing data from the students’ online learning trajectory that are accumulated and entered weekly into the LMS. “Students at risk” in the current paper refers to students who scored lower than 60 points on the course’s final assessment. In this study, we addressed the primary research question—How can teachers use few-shot learning materials from multiple SPOCs to develop an EWS to detect students at risk?—as well as the following two related research questions:
Data mining is widely used in educational institutions. The goal of educational data mining (EDM) is generally to explore the meaning behind data to improve the teaching process (Saa et al., 2019). In EDM, statistical models, mathematical algorithms, and machine learning methods are employed to analyze large data sets and reveal the correlation between learning behavior patterns and results. EDM enables teachers to gain an overview of the effective learning and behavior of students in the learning process (Ramaswami & Bhaskaran, 2009). Baradwaj and Pal (2011) summarized common data mining algorithms, including classification, clustering, the regression technique, the association rule, neural networks, decision trees, and the nearest neighbor method. Numerous researchers have applied these EDM techniques to predict student performance (Francis & Babu, 2019; Okubo et al., 2017; Sana et al., 2019).
EDM involves several steps. The first step is to determine the purpose of the research and collect data from an appropriate educational environment. The second step is to perform data preprocessing procedures. Subsequently, a prediction model is trained. After the model or pattern is established, the EDM results can provide the teacher with feedback for decision making or intervention. EDM has several applications such as predicting student performance; providing feedback for supporting instructors; offering personalization or recommendations to students; creating alerts for stakeholders; and performing student modeling, domain modeling, and student grouping and profiling (Baker et al., 2012; Romero & Ventura, 2013).
Along with the popularization of distance education, EDM research on LMS databases has also increased. For example, Chen et al. (2018) analyzed students’ learning behavior data in short online courses and predicted students’ learning performance at an early stage, i.e., after the first week of class (area under the curve ≥ 0.7). Kim et al. (2018) used deep learning to predict the results of students enrolled in online courses. Another study analyzed the LMS data of 658 students from nine courses in the first week and found that the online learning behaviors of students who passed the course differed significantly from those of students who did not pass (Milne et al., 2012).
As mentioned, EDM can be used to predict student learning performance, which then enables teachers to intervene early to improve student learning effectiveness. Currently, teachers can apply EDM technology first to establish a predictive model and subsequently to determine students’ actual behavior in the LMS; teachers can then apply a data-driven teaching intervention. This process involves teachers establishing a scientific EWS to help students succeed.
EWSs have been used by educational institutions to identify students who are at risk or off track (Barry & Reschly, 2012). An EWS helps teachers understand students’ behavior and performance through the collection of student behavioral data and building of a prediction model based on an algorithm. For example, researchers analyzed the behavioral data of students in distance courses at the Open University in the United Kingdom to predict their participation rate (Hussain et al., 2018). Teachers of distance courses can improve their students’ learning and participation by establishing monitoring and guidance strategies on the basis of information from an EWS (Rodrigues et al., 2016) and providing timely interventions and remedies, especially in situations where a student is unable to satisfy specific indicators (Howard et al., 2018). One of Europe’s largest distance education institutions, the Open University, developed four prediction models to identify students at risk of failure at an early stage of a course; these results are provided to teachers every week in the form of a feedback dashboard (Wolff et al., 2014).
Baker et al. (2015) built a model to make early predictions regarding the success and failure of students by analyzing students’ online course activity data. The accuracy rate of the model in identifying students most likely to perform poorly was 59.5%. Other research used the EWS plug-in on Moodle to build prediction models, and the accuracy rate was 60.8% (Jokhan et al., 2018). The model developed by Conijn et al. (2016) for predicting whether students would be able to pass their courses achieved an overall accuracy rate of 68.7%. Related research has revealed that EWS prediction models differ in terms of their accuracy in various distance courses. However, the key to a successful EWS remains whether teachers are able to obtain a highly accurate prediction model.
To enable the wider use of prediction models, researchers have considered the portability of such models (Gašević et al., 2016; Jayaprakash et al., 2014). For example, in the 2011 Open Academic Analytics Initiative, an open-source model for predicting student success was developed (Lauría et al., 2012). Subsequently, these researchers performed a cross-institution practical test with data from Purdue University and Marist College (N = 18,968 and 27,276, respectively) to assess the portability of the student performance prediction model. The results revealed that although the LMS as well as teaching methods and types differed between these two institutions, similarities could be found in the student performance prediction model and related analysis. Another study investigated the portability of prediction models among various courses in the same institution, revealing poorer results than those obtained in the aforementioned research. The researchers suggested that the poor results were due to the difference in instructional design between the courses (Rienties et al., 2015). Thus, if highly dissimilar instructional designs are used in different courses, considerable disparities might also appear in the degree of use of the LMS module.
To enable regular teachers to use small samples from multiple SPOCs to promote precision education, scholars have expanded empirical research to consider the portability of prediction models. In the current research, we collected small-sample data from four asynchronous distance courses offered through an LMS at a public university of science and technology in central Taiwan; the courses were all taught by the same teacher. The data were used to build a prediction model that was then developed into an EWS for identifying students at risk of failing the course; the EWS was subsequently tested on a new course. Because the courses were all taught by the same teacher, their instructional designs were highly similar. This mitigated the effect of instructional design differences on the model.
The LMS used in this research recorded every student’s detailed learning activities in a database, including platform logins; page clicks; test completions; the opening, closing, and downloading of course materials; the upload of assignments; assignment grades; and browsing and posting behavior in the discussion area. Data on student activities were saved in a log file format, which meant that a record would be generated whenever an activity occurred. We used an application programming interface (API) to gather the necessary information for the prediction and analysis model. We collected a total of 354,668 logs from the second semester of the 2017 academic year (2017-2018) and first semester of the 2018 academic year (2018-2019). These courses were all asynchronous online courses with a total of 1,278 students. The courses and their assignments were designed in accordance with the Taiwanese Ministry of Education’s digital course certification. Although the courses and their content differed, they were similar in their instructional design and course requirements, such as the weighting of grades, examinations, discussion topics, and number of assignments. Each asynchronous online course lasted 18 weeks. A summary of the online instructional design is provided in Table 1.
Table 1
Instructional Design of the Courses
| Week | Activity |
| 1, 12 | Synchronous teaching-Introduction, keynote speech |
| 2~8, 10-11, & 13-17 | Asynchronous teaching (video) Asynchronous discussion (forum) *9 Quiz *9 Assignment *2 |
| 9, 18 | Midterm/Final online exam |
Note. The asterisk (*) above means frequency of learning activities.
Data preprocessing, including data integration and data aggregation, was conducted on data from the LMS database to build the prediction model. The preprocessing stage of this research involved four steps. The first step was to filter out possible features from the database. We used analysis of variance as the basis for filtering learning features. We used the R 3.6.3 data mining software. Twenty features were generated (Table 2).
Table 2
Description of Features Used in the Prediction Models
| Feature no. | Name | Description |
| 1 | view_link_count | No. of views of supplementary materials |
| 2 | create | No. of articles posted in the discussion area |
| 3 | like | No. of likes for articles posted in the discussion area |
| 4 | read | No. of articles viewed in the discussion area |
| 5 | online_video_count | No. of clicks on teaching videos |
| 6 | forum_count | No. of clicks on the discussion area webpage |
| 7 | online_video_time | Time spent on the teaching videos webpage |
| 8 | total_mobile_time | Time spent using mobile devices to access the platform |
| 9 | weekday_time | Teaching video viewing duration (Monday-Friday) |
| 10 | weekend_time | Teaching video viewing duration (Saturday-Sunday) |
| 11 | morning_time | Teaching video viewing duration (morning) |
| 12 | noon_time | Teaching video viewing duration (afternoon) |
| 13 | night_time | Teaching video viewing duration (night) |
| 14 | total_watch_time | Total teaching video viewing duration |
| 15 | download_count | Number of downloads |
| 16 | homework_count | Number of times the assignment was clicked |
| 17 | homework_time | Assignment browsing duration |
| 18 | forum_time | Forum browsing duration |
| 19 | total_non_mobile_time | Time spent using computer equipment to access the platform |
| 20 | total_use_time | Total time accessing the course platform |
The focus of this research’s prediction model was on predicting whether a student would be able to pass the final examination. Every student was assigned a specific label, namely pass or fail. If the student obtained a score of ≥60% for the examination, they received the pass label; otherwise, the fail label was applied. We collected the information of 1,278 students, among which 1,135 passed and 143 failed.
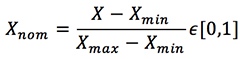
The second step of the preprocessing stage was to collate statistical information that represented every week’s cumulative learning progress. We gathered this cumulative learning progress information because the distance courses were all asynchronous. The teacher allowed the students to set their own speed for completing the online learning task within the 18 weeks of the semester. Subsequently, because this research used an unsupervised learning algorithm, an autoencoder was set up. Therefore, the third step involved using [0,1] normalization to normalize the characteristic variables; that is, the range of the characteristics was converted to the 0-1 range. In addition to the data used for classification (i.e., academic performance), all other variables were also normalized. The calculation is expressed in Formula (1).
| (1) |
The fourth step was to divide the information into a training set and test set. We randomly split the information into the training set and test set at a ratio of 7:3. The information in the training set was used to train the model, and the test set was used to evaluate the model to prevent the model from displaying over-fitting results.
Machine learning involves the automatic identification of a complex pattern according to the features extracted from a given data set and the making of an intelligent decision regarding new data (Kotsiantis et al., 2004). We employed a convolutional neural network (CNN) to build the prediction model.
We designed the prediction and analysis model in Python (Bowles, 2015) and used the PyTorch deep learning framework. A total of 18 predictive models were obtained in this research. Each forecasting model was based on 1 week (7 days) of data. When selecting training samples for the weekly predictive model, we selected the data set of students who had actual learning records in the LMS that week. Students who did not exhibit learning behavior that week were excluded from the training model sample for that week. To verify the model, we only selected 70% of each week’s student samples for each week’s model training. The remaining 30% was retained as the test data set of the predictive models.
Finally, to verify the portability of the prediction models, we gathered data from the Introduction to Artificial Intelligence distance course (N = 59) from the 2019-2020 academic year. That course was selected for verifying predictive models because it was taught by the same teacher and included a similar teaching design and similar course requirements as the courses used for the training models. Moreover, the course was offered at the same institution and used the same LMS as the other four courses.
We used a confusion matrix to verify the prediction model performance in classification. The confusion matrix is a binary classification, which is displayed in a two-by-two table. This table shows the training and performance of the network. The confusion matrix for each week is listed separately, and its format is presented in Table 3.
Table 3
Confusion Matrix for Binary Classification
| Actual | |||
| Passed | Failed | ||
| Predicted | Passed | TP | FP |
| Failed | FN | TN | |
Note. TP = true passed; FP = false passed; FN = false negative; TN = true negative.
True passed (TP) indicates the student was predicted to pass and eventually did pass. True negative (TN) reveals the number of failing students who were classified accurately. False passed (FP) refers to the number of students who failed the course but had been predicted to pass. False negative (FN) denotes students who were predicted to fail but eventually passed.
The accuracy, sensitivity, specificity, and precision values were calculated from the confusion matrix (Saito & Rehmsmeier, 2015). The relevant values for each model were calculated using equations 2 to 5.
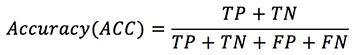 | (2) |
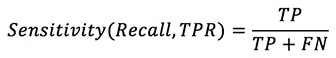 | (3) |
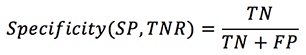 | (4) |
 | (5) |
The Fβ measure (F score) was obtained using the precision and sensitivity (recall) values (Toraman et al., 2019). A β value of 0.5, 1, or 2 is typically used (Goutte & Gaussier, 2005). Equation 6 was used to obtain the F score. In this study, β was 2.
 | (6) |
A commonly used metric when performing classification is accuracy (Hanley & McNeil, 1982; He & Garcia, 2009). Precision is equivalent to the positive predictive value, and specificity is equal to 1; the TPR (true positive rate) and sensitivity are equivalent to the recall rate, respectively.
We selected four courses for creating predictive models and one course for verifying the portability of the predictive models. The descriptive statistics are shown in Table 4.
Table 4
Descriptive Statistics of Courses
| Characteristic | Course name | |||
| Data Science (I) (n = 306) | Data Science (II) (n = 355) | Digital Social Innovation (n = 313) | Psychology (n = 304) | |
| School year | 2017-2018 | 2017-2018 | 2018-2019 | 2018-2019 |
| College | ||||
| Humanities | 40 | 59 | 29 | 38 |
| Engineering | 116 | 100 | 137 | 166 |
| Management | 74 | 95 | 79 | 50 |
| Design | 76 | 47 | 68 | 50 |
| Sex | ||||
| Female | 146 | 164 | 139 | 138 |
| Male | 160 | 191 | 174 | 166 |
| Year of study | ||||
| 1 | 59 | 44 | 80 | 85 |
| 2 | 100 | 133 | 49 | 80 |
| 3 | 95 | 150 | 66 | 122 |
| 4 | 47 | 27 | 114 | 15 |
| Extension | 5 | 1 | 4 | 2 |
Table 5 presents the descriptive statistics of every feature and the result of the test for statistical differences.
Table 5
Descriptive Statistics of Features
| Features’ column name | Passed | Failed | t Test | ||
| M | SD | M | SD | t-value | |
| download_count | 19.8 | 17.4 | 7.3 | 11.2 | -14.40* |
| view_link_count | 12.4 | 12.5 | 4.5 | 8.0 | -12.79* |
| create | 8.6 | 11.8 | 4.3 | 9.0 | -6.59* |
| like | 16.0 | 19.3 | 5.7 | 10.3 | -11.96* |
| read | 1037.7 | 988.3 | 411.4 | 728.4 | -11.70* |
| homework_count | 49.6 | 51.6 | 23.8 | 40.6 | -8.82* |
| online_video_count | 113.9 | 63.8 | 50.4 | 55.3 | -16.39* |
| forum_count | 156.2 | 127.7 | 74.3 | 111.6 | -10.50* |
| homework_time | 6861.0 | 10562.8 | 5097.1 | 33819.3 | -.85** |
| online_video_time | 52810.8 | 74392.0 | 19381.6 | 47743.4 | -9.07* |
| forum_time | 28565.9 | 48707.7 | 14588.9 | 52455.8 | -3.99* |
| total_mobile_time | 8974.1 | 12334.2 | 3928.8 | 7031.2 | -8.84* |
| total_non_mobile_time | 113422.0 | 117571.7 | 53263.1 | 142109.9 | -6.46* |
| total_use_time | 122396.1 | 117557.1 | 57191.9 | 142438.7 | -6.99* |
| weekday_time | 32475.2 | 22787.0 | 12932.3 | 18103.1 | -15.04* |
| holiday_time | 12039.6 | 12283.3 | 5833.7 | 10229.3 | -8.56* |
| morning_time | 11825.2 | 11611.4 | 5679.2 | 9516.3 | -9.08* |
| noon_time | 21604.5 | 16790.5 | 8850.8 | 12278.8 | -14.10* |
| night_time | 11085.1 | 10550.1 | 4236.1 | 6632.2 | -13.27* |
| total_watch_time | 44514.8 | 27379.6 | 18766.0 | 22748.2 | -15.97* |
*p < .001, **p = .39.
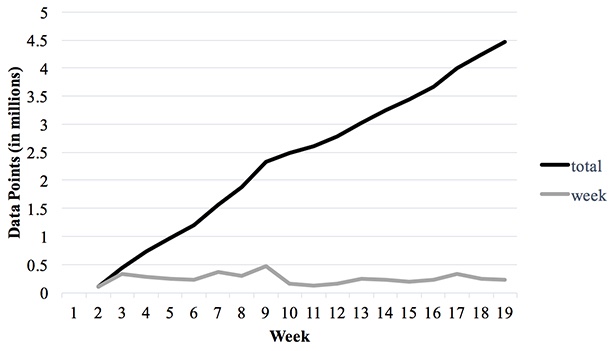
Figure 1 displays the number of data points accumulated per week for all four courses. The total number of data points was 4,468,906.
Figure 1
Cumulative Data Points and Weekly Distribution of the Four Courses
To create an early-stage prediction model, we obtained data on the features from the training set each week. We created a total of 18 prediction models based on each week’s accumulated data. The confusion matrix was used to determine the specificity, precision, sensitivity, F-Measure and accuracy of the models. The results presented in Table 6. indicated that when looking at accuracy column, we found that the average percentage ranges from 59% at the 2nd week to 84% at the 18th week in training our model. However, the percentage ranges from 57% at the 7th week to 84% at the 18th week in testing our model. Notably, the accuracy of training data rises from 59% at the 7th week to 80% at the 8th week and the accuracy of testing data rises from 57% at the 7th week to 77% at the 8th week. Altogether, it suggests that we could predict whether students will fail or not in the middle of 18 weeks.
Table 6
Specificity, Precision, Sensitivity, F-Measure, and Accuracy Results (%)
| Week | Amount of data | Specificity | Precision | Sensitivity | F-Measure | Accuracy | |||||
| Train | Test | Train | Test | Train | Test | Train | Test | Train | Test | ||
| 1 | 113,585 | 99 | 100 | 95 | 100 | 6 | 6 | 11 | 11 | 22 | 16 |
| 2 | 443,040 | 55 | 63 | 87 | 91 | 60 | 60 | 71 | 72 | 59 | 60 |
| 3 | 726,397 | 70 | 68 | 91 | 89 | 61 | 58 | 73 | 70 | 62 | 59 |
| 4 | 973,496 | 71 | 77 | 90 | 93 | 58 | 57 | 71 | 71 | 60 | 61 |
| 5 | 1,203,686 | 69 | 69 | 91 | 92 | 70 | 69 | 79 | 79 | 69 | 69 |
| 6 | 1,572,754 | 79 | 85 | 92 | 95 | 59 | 62 | 72 | 75 | 63 | 66 |
| 7 | 1,872,702 | 83 | 85 | 93 | 94 | 53 | 51 | 68 | 66 | 59 | 57 |
| 8 | 2,336,105 | 69 | 71 | 92 | 92 | 83 | 78 | 87 | 84 | 80 | 77 |
| 9 | 2,492,457 | 81 | 79 | 93 | 93 | 63 | 57 | 75 | 71 | 66 | 61 |
| 10 | 2,614,689 | 56 | 55 | 89 | 90 | 89 | 88 | 89 | 89 | 82 | 82 |
| 11 | 2,776,942 | 77 | 72 | 93 | 92 | 74 | 72 | 82 | 81 | 75 | 72 |
| 12 | 3,028,478 | 79 | 78 | 93 | 93 | 72 | 67 | 81 | 78 | 74 | 69 |
| 13 | 3,255,458 | 59 | 65 | 89 | 91 | 89 | 84 | 89 | 87 | 83 | 80 |
| 14 | 3,441,195 | 71 | 73 | 92 | 93 | 84 | 79 | 88 | 85 | 82 | 78 |
| 15 | 3,667,310 | 74 | 78 | 92 | 94 | 80 | 74 | 86 | 83 | 79 | 74 |
| 16 | 3,992,200 | 76 | 76 | 93 | 94 | 78 | 77 | 85 | 85 | 78 | 77 |
| 17 | 4,241,995 | 73 | 72 | 92 | 94 | 82 | 82 | 87 | 88 | 80 | 80 |
| 18 | 4,468,906 | 61 | 60 | 90 | 91 | 90 | 89 | 90 | 90 | 84 | 84 |
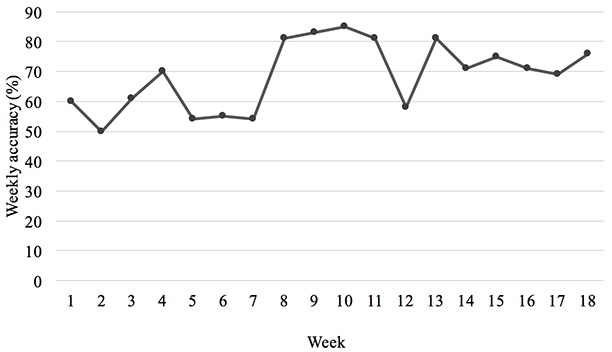
We verified the prediction model accuracy against the learning data gathered from the students taking the Introduction to Artificial Intelligence distance course in the 2019-2020 academic year. The prediction model was assessed in terms of its accuracy in predicting the academic performance of the students in this new course; the results revealed an accuracy rate of ≥81% from the eighth week onward. The verification results of the prediction model are displayed in Figure 2.
Figure 2
Weekly Accuracy of the Verified Course
Developing an EWS and identifying students at risk in a timely manner is one of the strategies of precision education for which schools and teachers have been advocating. Compared with face-to-face classes, distance courses enable the collection of more student learning information. However, for teachers who do not run MOOCs, gathering sufficient training information to build a usable prediction model themselves is a considerable challenge. The proportion of students who fail their SPOC is often higher than that of students who have face-to-face classes, especially for distance courses that use asynchronous teaching long term or during periods of special restrictions (e.g., contact restriction during a pandemic). Teachers’ successful collection of small-sample learning information from multiple SPOCs and training of a portable prediction model would greatly benefit the development of an EWS, enabling teachers to employ precision education. This research is based on few-shot learning practice which feeds a predictive model with a very small amount of training data to discover patterns in data regarding accurate predictions. In this research, we gathered learning information from one teacher’s multiple SPOCs on an LMS platform to create an EWS for identifying students at risk of failing. Our results revealed that students at risk can be correctly identified from the fifth week of the course onward on the basis of their online learning behavior (accuracy was 69%). The model’s accuracy reached ≥ 80% for weeks 8, 10, 13, 14, 17, and 18. In this study, we obtained the accuracy of the confusion matrix to verify predictive models’ performance. Additionally, the study also obtained the sensitivity, specificity, precision, and F measurement for each week to help teachers make comprehensive judgments when choosing different weekly patterns on the basis of their early warning plan. The main purpose of this research was to collect small-sample information from multiple SPOCs with a similar instructional design and taught by a single teacher to build a usable prediction model. Our findings help expand knowledge on the portability of prediction models and help confirm previous research that has indicated that the difference in instructional design between courses negatively affects the accuracy of student performance prediction. Therefore, teachers may use this prediction model in other distance courses that have similar online instructional designs and apply instructional interventions for students who are identified. Through instructional intervention, the online learning behavior of students taking SPOCs can be modified and their online learning experience enriched, such as through self-regulated learning. We endeavor to expand this research project by integrating automated data collection, feature selection, and model update mechanisms into the prediction model to enhance the model’s adaptability and usability.
In this study, we attempted to address a problem in EWS design: the necessity of first collecting big data on student learning before the development of early warning models. As a possible supporting technology, artificial intelligence has emerged in many industries. However, because of the lack of large data sets, educational institutions have yet to widely adopt this technology. In this context, teachers also miss the opportunity to develop predictive models for their SPOCs and cannot establish an EWS. Because teachers cannot directly supervise students’ online learning behaviors as they would in the classroom, students who take online asynchronous courses are at an increased risk of failure.
The findings of this research may be of value to those who teach asynchronous distance courses, educational authorities, and information technology (IT) directors of academic institutions.
Teachers should consider other factors in addition to online teaching design and regard the online learning environment as a sustainable and circular ecosystem. For example, in this study, we used former students’ learning data sets and used a CNN to establish an early warning model to reduce future students’ learning risk. This system is sustainable because new data can be integrated into the early warning model to improve its accuracy. In this manner, teachers can offer precision education through data-driven interventions. This system can support teachers in realizing the digital transformation of education. Such a system also enables teachers to devote more energy to supporting students’ success in a timely and personalized manner.
Educational authorities should fine-tune their vision, draft policies, and provide funding for the development of learner-oriented artificial intelligence (AI) to enrich students’ distance learning experiences and teacher effectiveness in SPOCs. For example, educational authorities could organize seminars to promote dialogue among university teachers, data analysts, and IT specialists. Administrators could also use case studies of successful AI applications in teaching as the basis for training materials to develop AI applications in distance education. Finally, relevant authorities could host conferences or workshops on the ethics of applying AI in education to enhance the knowledge of teachers and related personnel.
IT directors of academic institutions should establish systems that enable teachers to rapidly obtain LMS course data. For example, this could be done by establishing a learning data warehouse where online course data could be stored or providing an automatic access mechanism that gives teachers timely access to data (e.g., through an API). IT directors should also organize and publish descriptions of the data set, such as in a codebook.
The data sets we used to build the EWS were all derived from a university in Taiwan. This research also preliminarily verified that the early warning model could be transferred to another course if its instructional design was similar to that of the source course. However, we did not further examine the uncertainty factors that may cause model migration to fail because of the bias in training data collection; this may arise for courses with multicultural learners or in the transfer of the model for use on students in other grades (e.g., K-12).
Baker, R. S. J. D., Costa, E., Amorim, L., Magalhães, J., & Marinho, T. (2012). Mineração de ados ducacionais: Conceitos, écnicas, erramentas e plicações (Educational data mining: Concepts, techniques, tools and applications. Updating day in informatics in education). Jornada de Atualização em Informática na Educação, 1, 1-29.
Baker, R. S., Lindrum, D., Lindrum, M. J., & Perkowski, D. (2015). Analyzing early at-risk factors in higher education e-learning courses. In J. G. Boticario, O. C. Santos, C. Romero, M. Pechenizkiy, A. Merceron, P. Mitros, J. M. Luna, C. Mihaescu, P. Moreno, A. Hershkovitz, S. Ventura, & M. Desmarais (Eds.), Proceedings of the 8th International Conference on Educational Data Mining (pp. 150-155). http://www.columbia.edu/~rsb2162/2015paper41.pdf
Baradwaj, B. K., & Pal, S. (2011). Mining educational data to analyze students performance. International Journal of Advanced Computer Science and Applications, 2(6), 63-69. http://dx.doi.org/10.14569/IJACSA.2011.020609
Barry, M., & Reschly, A. (2012). Longitudinal predictors of high school completion. School Psychology Quarterly, 27(2), 74-84. https://doi.org/10.1037/a0029189
Bawa, P. (2016). Retention in online courses: Exploring issues and solutions—A literature review. SAGE Open, 6(1), 1-11. https://doi.org/10.1177/2158244015621777
Bowles, M. (2015). Machine learning in Python—Essential techniques for predictive analysis. Wiley.
Cerezo, R., Sánchez-Santillán, M., Paule-Ruiz, M. P., & Núñez, J. C. (2016). Students’ LMS interaction patterns and their relationship with achievement: A case study in higher education. Computers & Education, 96, 42-54. https://doi.org/10.1016/j.compedu.2016.02.006
Chen, W., Brinton, C. G., Cao, D., Mason-Singh, A., Lu, C., & Chiang, M. (2018). Early detection prediction of learning outcomes in online short-courses via learning behaviors. IEEE Transactions on Learning Technologies, 12(1), 44-58. http://dx.doi.org/10.1109/TLT.2018.2793193
Conijn, R., Kleingeld, A., Matzat, U., Snijders, C., & van Zaanen, M. (2016, December 10). Influence of course characteristics, student characteristics, and behavior in learning management systems on student performance [Paper presentation]. Neural Information Processing Systems (NIPS) Workshop on Machine Learning for Education 2016, Barcelona, Spain.
Conijn, R., Snijders, C., Kleingeld, A., & Matzat, U. (2017). Predicting student performance from LMS data: A comparison of 17 blended courses using Moodle LMS. IEEE Transactions on Learning Technologies, 10(1), 17-29. https://doi.org/10.1109/TLT.2016.2616312
Costa, E. B., Fonseca, B., Santana, M. A., de Araújo, F. F., & Rego, J. (2017). Evaluating the effectiveness of educational data mining techniques for early prediction of students’ academic failure in introductory programming courses. Computers in Human Behavior, 73, 247-256. https://doi.org/10.1016/j.chb.2017.01.047
Francis, B. K., & Babu, S. S. (2019). Predicting academic performance of students using a hybrid data mining approach. Journal of Medical Systems, 43(6), 162.
Gašević, D., Dawson, S., Rogers, T., & Gasevic, D. (2016). Learning analytics should not promote one size fits all: The effects of instructional conditions in predicting academic success. The Internet and Higher Education, 28, 68-84. https://doi.org/10.1016/j.iheduc.2015.10.002
Goutte C., & Gaussier E. (2005). A probabilistic interpretation of precision, recall and F-score, with implication for evaluation. In D. E. Losada & J. M. Fernández-Luna (Eds.), Lecture Notes in Computer Science: Vol. 3408. Advances in Information Retrieval. ECIR 2005 (pp. 345-359). https://doi.org/10.1007/978-3-540-31865-1_25
Hanley, J. A. & McNeil, B. J. (1982). The meaning and use of the area under a receiver operating characteristic (ROC) curve. Radiology, 143(1), 29-36. https://doi.org/10.1148/radiology.143.1.7063747
He, H., & Garcia, E. (2009). Learning from imbalanced data. IEEE Transactions on Knowledge and Data Engineering, 21(9), 1263-1284. https://doi.org/10.1109/TKDE.2008.239
He, J., Bailey, J., Rubinstein, B. I. P., & Zhang, R. (2015). Identifying at-risk students in massive open online courses. In B. Bonet & S. Koenig (Eds.), Proceedings of the twenty-ninth AAAI conference on artificial intelligence (pp. 1749-1755). AAAI. https://www.aaai.org/ocs/index.php/AAAI/AAAI15/paper/view/9696/9460
Howard, E., Meehan, M., & Parnell, A. (2018). Contrasting prediction methods for early warning systems at undergraduate level. The Internet and Higher Education, 37, 66-75. https://doi.org/10.1016/j.iheduc.2018.02.001
Hu, Y.-H., Lo, C.-L., & Shih, S.-P. (2014). Developing early warning systems to predict students’ online learning performance. Computers in Human Behavior, 36, 469-478. https://doi.org/10.1016/j.chb.2014.04.002
Hussain, M., Zhu, W., Zhang, W., & Abidi, S. M. R. (2018). Student engagement predictions in an e-learning system and their impact on student course assessment scores. Computational Intelligence and Neuroscience, 2018, Article 6347186, 1-21. https://doi.org/10.1155/2018/6347186
Jayaprakash, S. M., Moody, E. W., Lauría, E. J., Regan, J. R., & Baron, J. D. (2014). Early alert of academically at-risk students: An open source analytics initiative. Journal of Learning Analytics, 1(1), 6-47. https://doi.org/10.18608/jla.2014.11.3
Jokhan, A., Sharma, B., & Singh, S. (2018). Early warning system as a predictor for student performance in higher education blended courses. Studies in Higher Education, 44(11), 1900-1911. https://doi.org/10.1080/03075079.2018.1466872
Kim, B., Vizitei, E., & Ganapathi, V. (2018). Gritnet: Student performance prediction with deep learning. In K. E. Boyer & M. Yudelson, (Eds.), Proceedings of the 11th international conference on educational data mining. International Educational Data Mining Society. https://arxiv.org/abs/1804.07405
Kotsiantis, S. B. (2011). Use of machine learning techniques for educational proposes: A decision support system for forecasting students’ grades. Artificial Intelligence Review, 37(4), 331-344. https://doi.org/10.1007/s10462-011-9234-x
Kotsiantis, S. B., Pierrakeas, C., & Pintelas, P. (2004). Predicting students’ performance in distance learning using machine learning techniques. Applied Artificial Intelligence, 18(5), 411-426. https://doi.org/10.1080/08839510490442058
Lauría, E. J. M., Baron, J. D., Devireddy, M., Sundararaju, V., & Jayaprakash, S. M. (2012). Mining academic data to improve college student retention. In S. Dawson, C. Haythornthwaite, S. B. Shum, D. Gašević, & R. Ferguson (Eds.), LAK ’12: Proceedings of the 2nd international conference on learning analytics and knowledge (pp. 139-142). ACM. https://doi.org/10.1145/2330601.2330637
Li, X., Wang, T., & Wang, H. (2017). Exploring N-gram features in clickstream data for MOOC learning achievement prediction. In Z. Bao, G. Trajcevski, L. Chang, & W. Hua (Eds.), Lecture Notes in Computer Science: Vol. 10179. Database Systems for Advanced Applications. DASFAA 2017 (pp. 328-339). https://doi.org/10.1007/978-3-319-55705-2_26
Macfadyen, L. P., & Dawson, S. (2010). Mining LMS data to develop an “early warning system” for educators: A proof of concept. Computers & Education, 54(2), 588-599. https://doi.org/10.1016/j.compedu.2009.09.008
Milne, J., Jeffrey, L. M., Suddaby, G., & Higgins, A. (2012). Early identification of students at risk of failing. In M. Brown, M. Harnett, & T. Stewart (Eds.), Future challenges, sustainable futures: Proceedings ASCILITE (pp. 657-661). http://www.ascilite.org/conferences/Wellington12/2012/images/custom/milne,_john_-_early_identification.pdf
Morris, L. V., Finnegan, C., & Wu, S.-S. (2005). Tracking student behavior persistence and achievement in online courses. The Internet and Higher Education, 8(3), 221-231. https://doi.org/10.1016/j.iheduc.2005.06.009
Okubo, F., Yamashita, T., Shimada, A., & Ogata, H. (2017). A neural network approach for students’ performance prediction. In A. Wise, P. H. Winne, G. Lynch, X. Ochoa, I. Molenaar, S. Dawson, & M. Hatala (Eds.), LAK ’17: Proceedings of the 7th international learning analytics and knowledge conference (pp. 598-599). ACM. https://doi.org/10.1145/3027385.3029479
Papamitsiou, Z., & Economides, A. A. (2014). Learning analytics and educational data mining in practice: A systematic literature review of empirical evidence. Journal of Educational Technology & Society, 17(4), 49-64. https://www.jstor.org/stable/pdf/jeductechsoci.17.4.49
Ramaswami, M., & Bhaskaran, R.(2009). A study on feature selection techniques in educational data mining. Journal of Computing, 1(1), 7-11. https://arxiv.org/abs/0912.3924
Rienties, B., Toetenel, L., & Bryan, A. (2015). ‘Scaling up’ learning design: Impact of learning design activities on LMS behavior and performance. In J. Baron, G. Lynch, N. Maziarz, P. Blikstein, A. Merceron, & G. Siemens (Eds.), LAK ’15: Proceedings of the 5th international conference on learning analytics and knowledge (pp. 315-319). https://doi.org/10.1145/2723576.2723600
Rodrigues, R. L., Ramos, J. L. C., Sedraz, J., & Gomes, A. S. (2016). Discovery engagement patterns MOOCs through cluster analysis. IEEE Latin America Transactions, 14(9), 4129-4135. https://doi.org/10.1109/TLA.2016.7785943
Romero, C., & Ventura, S. (2013). Data mining in education. WIREs, 3(1), 12-27. https://doi.org/10.1002/widm.1075
Romero, C., Ventura, S., & García, E. (2008). Data mining in course management systems: Moodle case study and tutorial. Computers & Education, 51(1), 368-384. https://doi.org/10.1016/j.compedu.2007.05.016
Saa, A. A., Al-Emran, M., & Shaalan, K. (2019). Factors affecting students’ performance in higher education: A systematic review of predictive data mining techniques. Technology, Knowledge and Learning, 24, 567-598.
Saito, T., & Rehmsmeier, M. (2015). The precision-recall plot is more informative than the ROC plot when evaluating binary classifiers on imbalanced datasets. PLoS ONE, 10(3), 1-21. https://doi.org/10.1371/journal.pone.0118432
Sana, B., Siddiqui, I. F., & Arain, Q. A. (2019). Analyzing students’ academic performance through educational data mining. 3C Tecnología. Glosas de innovación aplicadas a la pyme, 29(2), 402-421. http://dx.doi.org/10.17993/3ctecno.2019.specialissue2.402-421
Tempelaar, D. T., Rienties, B., & Giesbers, B. (2015). In search for the most informative data for feedback generation: Learning analytics in a data-rich context. Computers in Human Behavior, 47, 157-167. https://doi.org/10.1016/j.chb.2014.05.038
Toraman, S., Tuncer, S. A., & Balgetir, F.(2019). Is it possible to detect cerebral dominance via EEG signals by using deep learning? Medical Hypotheses, 131, Article 109315. https://doi.org/10.1016/j.mehy.2019.109315
Wolff, A., Zdrahal, Z., Herrmannova, D., Kuzilek, J., & Hlosta, M. (2014). Developing predictive models for early detection of at-risk students on distance learning modules. In M. Pistilli, J. Willis, D. Koch, K. Arnold, S. Teasley, & A. Pardo (Eds.), LAK ’14: Proceedings of 4th international learning analytics and knowledge conference (pp. 24-28). http://oro.open.ac.uk/40669/

Using Few-Shot Learning Materials of Multiple SPOCs to Develop Early Warning Systems to Detect Students at Risk by Yung-Hsiang Hu is licensed under a Creative Commons Attribution 4.0 International License.