Volume 23, Number 1
Eric Araka1, Robert Oboko2, Elizaphan Maina1, and Rhoda Gitonga1
1Kenyatta University, 2University of Nairobi
With the increased emphasis on the benefits of self-regulated learning (SRL), it is important to make use of the huge amounts of educational data generated from online learning environments to identify the appropriate educational data mining (EDM) techniques that can help explore and understand online learners’ behavioral patterns. Understanding learner behaviors helps us gain more insights into the right types of interventions that can be offered to online learners who currently receive limited support from instructors as compared to their counterparts in traditional face-to-face classrooms. In view of this, our study first identified an optimal EDM algorithm by empirically evaluating the potential of three clustering algorithms (expectation-maximization, agglomerative hierarchical, and k-means) to identify SRL profiles using trace data collected from the Open University of the UK. Results revealed that agglomerative hierarchical was the optimal algorithm, with four clusters. From the four clusters, four SRL profiles were identified: poor self-regulators, intermediate self-regulators, good self-regulators, and exemplary self-regulators. Second, through correlation analysis, our study established that there is a significant relationship between the SRL profiles and students’ final results. Based on our findings, we recommend agglomerative hierarchical as the optimal algorithm to identify SRL profiles in online learning environments. Furthermore, these profiles could provide insights on how to design a learning management system which could promote SRL, based on learner behaviors.
Keywords: educational data mining, EDM, self-regulated learning, SRL profile, algorithm, agglomerative hierarchical clustering, clustering algorithm
The increased adoption of technology to enhance learning along a continuum that ranges from physical classrooms to online learning has opened valuable opportunities for decision makers in institutions of learning. The current coronavirus pandemic has also forced many institutions of higher learning to adopt online teaching and learning resulting in many new datasets being generated. These datasets can be used to understand how to enhance learning pedagogies such as self-regulated learning (SRL) (Coman et al., 2020). Machine learning offers the potential to explore educational data to detect learner profiles that can be used to provide targeted interventions to online students. The behavior of students in online learning environments can be measured from log data that contains page views, access to learning materials, frequency and duration of logins, assignment submission deadlines, number of clicks on learning materials, number of forum posts by students, and quiz and assignment scores (Aljohani et al., 2019; Alshabandar et al., 2018; Barnard et al., 2010; Kuzilek et al., 2017; Lodge & Corrin, 2017).
Over the last three decades since the recognition of SRL, there has been emphasis on the importance of SRL skills in relation to academic achievement. SRL is a process through which students manage their learning while being guided by their own motivation, behavior, and metacognition. Students with high levels of SRL skills are able to play an active role in achieving their academic goals (Klug et al., 2011; Pintrich, 2004). Learners who employ SRL strategies such as time management, help-seeking, and self-monitoring perform better than those who do not (Broadbent & Poon, 2015). The identification of SRL profiles in online learning has been based mostly on data collected using student self-report tools (Barnard et al., 2010; Broadbent & Fuller-Tyszkiewicz, 2018; Valle et al., 2008; Yot-Domínguez & Marcelo, 2017). These self-report tools include the Online Self-Regulated Learning Questionnaire (Barnard et al., 2010), the Motivated Strategies Learning Questionnaire (Broadbent & Fuller-Tyszkiewicz, 2018; Valle et al., 2008), and the Survey of Self-Regulated Learning with Technology at the University (Yot-Domínguez & Marcelo, 2017). Although self-report tools are easy to implement when measuring SRL, students tend to overestimate their skills, and hence may fail to capture the actual learning behaviors exhibited during an online course (Araka et al., 2020; Gašević et al., 2017). Learners also often may fail to recall the strategies they use during learning as self-report tools are employed before or after the learning process (Broadbent & Fuller-Tyszkiewicz, 2018; Elsayed et al., 2019). Literature reveals that researchers rely on both trace data collected from educational systems such as learning management systems (LMSs) and self-report data (Ainscough et al., 2019; Çebi & Güyer, 2020; Gašević et al., 2017; Kim et al., 2018). Using trace data to measure SRL strategies has been viewed as unobtrusive since the tools are deployed without learners being aware and, therefore, they do not affect leaners’ engagement behavior and performance (Schraw, 2010). Educational data mining (EDM) techniques therefore are likely to measure and profile learners more accurately as compared to self-report tools, as they use actual datasets collected from online learning environments. EDM is becoming extremely valuable for educators and decision makers especially in higher education institutions as it provides great opportunities for exploring huge datasets already stored in many learning environments. EDM has made it possible to detect students’ online learning behavior (Khanna et al., 2016; Siemens & Baker, 2012; Winne & Baker, 2013). With EDM techniques being part of machine learning algorithms, there is a need for an empirical analysis to establish the optimal values of parameters and the best algorithm to use with educational data.
Recent studies have investigated the measurement and promotion of SRL on massive open online courses (MOOCs) (Kizilcec et al., 2017; Maldonado-Mahauad et al., 2018; Wong et al., 2020). However, there is little evidence to show how university and college students self-regulate when engaging in open and distributed learning using LMSs which are commonly used to facilitate distance learning in higher education (Araka et al., 2020). In view of this, the current study investigates SRL profiles using a dataset collected from the Open University, UK so as to allow for more research on the relationship between students’ learning behaviors and academic performance. Moreover, the study seeks to inform researchers, educators, and designers of online learning environments about the optimal EDM techniques that can be used to design and provide targeted interventions for ODL students.
The profiling of learners into groups based on students’ SRL skills has been done using step-wise cluster analysis (Ainscough et al., 2019; Çebi & Güyer, 2020; Valle et al., 2008; Yot-Domínguez & Marcelo, 2017), a K-means clustering algorithm (Li et al., 2018), latent class analysis (Barnard et al., 2010), and agglomerative hierarchical clustering algorithm (Gašević et al., 2017). Our review of literature revealed that different data mining techniques vary in their performance depending of the source of the dataset and type of e-learning environment. For example, EDM techniques used to measure and promote SRL for MOOCs are different from those used in LMSs. Moreover, there is a lack of evidence showing which algorithm performs better in identifying SRL profiles from data collected from an LMS. In view of this, the current study explored the appropriate EDM algorithm that could be used to profile online learners and group them into appropriate clusters so as to allow for the provision of interventions geared towards supporting SRL. Specifically, the study was guided by the following research questions:
In this paper, the literature review section discusses previous studies on the profiling of learners according to their SRL strategies. Next, the methodology used to address the research questions is outlined. A review of the current EDM techniques being used to identify SRL profiles follows. Then, experimental evaluation of the EDM algorithms identified from the review is presented. The results section offers the findings of the experimental evaluation. Finally, the conclusions and future implications of the study are discussed.
Current research has proved that data mining techniques can be used to enrich decision making in different domains such as finance, healthcare, and e-commerce by transforming raw data into information (Madni et al., 2017). Educational data mining is also critical in analyzing data to improve pedagogical aspects of teaching and learning (Coman et al., 2020). Open and distributed learning has tremendously grown and been adopted by institutions of higher learning (Saadati et al., 2021). Students who engage in online learning, especially higher education, are supposed to play an active role in the learning process. However, literature reveals that students, individually or collectively, do not regulate their own learning (Cerezo et al., 2016; Dabbagh & Kitsantas, 2005). Additionally, online learners are not directly supported by instructors as compared to their counterparts in traditional face-to-face learning. Consequently, there is a need to provide support for SRL and student engagement that is geared towards enhancing self-regulatory skills (Silvola et al., 2021). In view of this, there is need to examine how learners behave and engage in online learning so as to establish the right interventions to be provided to the learners. Student engagement in online learning, especially behavioral and cognitive aspects, are observable elements that indicate how students participate and get involved in their learning activities (Silvola et al., 2021). SRL, on the other hand, is concerned with learners being proactive in their learning, taking their own initiative to control their learning by setting academic goals and identifying strategies to achieve those goals (Azevedo, 2009; Zimmerman, 1990). In the current study, student level engagement behavior in online learning activities is therefore an indicator of SRL level. For instance, a highly active student, identified through the number of resources accessed and the learning activities engaged on, is in control of the learning process and therefore exhibits a high level of self-regulatory behavior. Students’ engagement behaviors and learning patterns in online learning environments, such as an LMS, can be measured using trace data. The dataset features may include content or page views, frequency of logins, access to learning materials, forum posts by students, and quiz and assignment scores (Araka et al., 2020).
Previous studies indicate that distinct profiles of SRL exist among students who engage in online and blended learning. The profiles can be identified using EDM methods applied to self-report data, trace data, or both. For example, Barnard et al. (2010) used latent class analysis to identify five profiles of self-regulators: super self-regulators, competent self-regulators, forethought-endorsing self-regulators, performance/reflection self-regulators, and non/minimal self-regulators. The algorithm was applied on data collected using a self-report online questionnaire known as the Online Self-Regulated Learning Questionnaire (OSLQ) (Barnard et al., 2010).
In another study, Li et al. (2018) analyzed trace data that comprised of logs related to access of learning materials, completion of quizzes, and answer logs to develop profiles in SRL. From the data, various behaviors were measured including number of completed quizzes, total access time, reviewing time, scores of completed quizzes, anti-procrastination and irregularity of study interval, and pacing (Li et al., 2018). The k-means clustering algorithm was applied to the data and four distinct clusters were identified: early completers, late completers, early dropouts, and late dropouts. However, the data only comprised of assessment data which did not indicate student interactions with the course. The students’ activities were limited to listening and reading, and this may not reflect actual learner behaviors in an online learning environment.
Ainscough et al. (2019) used a mixed approach that included both trace data and self-report data to profile online learners into three clusters: high self-regulators, medium self-regulators, and low self-regulators. While trace data was used during the analysis, the SRL skills that were identified were based on self-report data collected from learners in various stages during the study period. A two-step cluster analysis was used to group the learners. The first step was the pre-cluster formation. In the second, the hierarchical clustering algorithm was used to merge the pre-clusters, leading to the three distinct groups (Ainscough et al., 2019). The trace data used in the study comprised average word count for each meta-learning question, submission time for the meta-learning tasks, and completion rate of the tasks.
Finally, Çebi and Güyer (2020) presented various learning activities to students using the Moodle LMS. The learning activities included tutorials, video, concept maps, exercises, and summary, highlight, and forum activities. The data were collected from three sources: self-report data, trace data, and assessment data. Cluster analysis involving hierarchical clustering and k-means were used to identify three clusters. The study, however, was limited to only three weeks and a single course and, therefore, researchers may not have had the opportunity for proper observance of behavior change in leaners as far as SRL is concerned. Table 1 presents a summary of the rest of the studies that we reviewed.
Table 1
Summary of SRL Profiles Identified From Previous Studies
| Reference | SRL profiles identified | Data source | Technique to identify profiles |
| Valle et al. (2008) |
| SR | Two-step cluster analysis |
| Barnard et al. (2010) |
| SR | Latent class analysis |
| Yot-Domínguez and Marcelo (2017) |
| SR | Stepwise cluster analysis
|
| Gašević et al. (2017) |
| SR and TD | Agglomerative hierarchical clustering (based on Ward’s algorithm) |
| Li et al. (2018) |
| TD | K-means clustering |
| Broadbent and Fuller-Tyszkiewicz (2018) |
| SR | Latent profile analysis |
| Kim et al. (2018) |
| SR and TD | K-medoids clustering |
| Ainscough et al. (2019) |
| SR and TD | Two-step cluster analysis |
| Peach et al. (2019) |
| TD | Mathematical framework (based on dynamic time warping kernel and clustering algorithm) |
| Çebi and Güyer (2020) |
| SR, TD and AD | Cluster analysis
|
Note. SR = self-report. TD = trace data. AD = assessment data.
In their review, Elsayed et al. (2019) established that among the EDM techniques used in measuring SRL, clustering algorithms were most common (Elsayed et al., 2019). The EDM algorithms used in profiling SRL in online learning environments included expectation-maximization (Bouchet et al., 2013; Manzanares et al., 2017; Matcha et al., 2019), k-means (Çebi & Güyer, 2020; Kizilcec et al., 2013; Li et al., 2018; Valdiviezo et al., 2013; Yot-Domínguez & Marcelo, 2017; Zheng et al., 2020), agglomerative hierarchical (Cicchinelli et al., 2018; Maldonado-Mahauad et al., 2018; Matcha et al., 2019; Sun et al., 2016), and process and sequence mining (Kinnebrew et al., 2013; Matcha et al., 2019; Rodriguez et al., 2014; Wong et al., 2019). Classification algorithms included k-nearest neighbor (Syuhada et al., 2020), neural networks (Yu et al., 2018), and logistic regression (Bosch et al., 2018). The review of literature reveals a lack of evidence concerning which algorithm performs better in identifying SRL profiles from trace data collected from online learning environments. Consequently, the current study explores which EDM algorithm would be best to profile learners, group them into appropriate clusters, and establish the association between profiles and students’ final results.
To address the research questions in the current study, we used a mixed method approach. First, a systematic review of the literature on current EDM techniques used to profile SRL was carried out. The review followed five steps of systematic review methodology (Khan et al., 2003). The review stages included (a) framing the research questions, (b) identifying relevant literature, (c) setting the articles’ assessment criteria, (d) presenting review results, and (e) discussing the results. This review formed the foundation for the second study which involved experimental evaluation of EDM algorithms in order to establish the optimal algorithm to identify SRL profiles from a dataset obtained from the Open University in the UK. Finally, correlation analysis was used to identify the association between the SRL profiles and students’ academic performance.
The reviewed articles in this study were iteratively searched from international journals and databases which included Google Scholar, SCOPUS, Science Direct, Elsevier, ERIC, IEEE Xplore, and ACM digital libraries. The articles were searched using keywords: “educational data mining techniques” AND “learner analytics” AND “measurement of self-regulated learning” AND “assessment of self-regulated learning” AND “clickstream data” AND “student behaviors” AND “online learning” AND “self-regulated learning profiles.” A total of 72 papers was identified. After reading the full text of each article and applying the inclusion criteria described in Khan et al., 2003, 48 papers were removed. A total of 24 papers, 12 journal articles and 12 conference articles, met the inclusion criteria. A summary is presented in Table 2.
There were four inclusion criteria used to obtain relevant literature for the systematic review:
In this section, we present a review of the literature on current EDM techniques used to group learners into various SRL profiles according to their behavioral interactions in online learning environments. Table 2 presents a summary.
Table 2
Algorithms Used to Measure SRL in Online Learning Environments
| Reference | Data source | Feature set | EDM technique | Algorithm used |
| Bouchet et al. (2013) | MetaTutor trace data & self-report data |
| Clustering | Expectation-maximization |
| Zheng et al. (2020) | Trace data |
| Clustering | K-means |
| Valdiviezo et al. (2013) | LMS trace data |
| Clustering | K-means |
| Maldonado-Mahauad et al. (2018) | MOOC trace data & self-report data |
| Clustering | Agglomerative hierarchical |
| Manzanares et al. (2017) | LMS trace data & self-report data |
| Clustering | Expectation-maximization |
| Cicchinelli et al. (2018) | LMS trace data |
| Clustering | Agglomerative hierarchical |
| Kizilcec et al. (2013) | MOOC trace data |
| Clustering | K-means |
| Park et al. (2018) | LMS trace data |
| Clustering | Probability model based clustering (Poisson mixture model) |
| Sun et al. (2016) | LMS trace data & self-report data |
| Clustering | Agglomerative hierarchical |
| Matcha et al. (2019) | Trace data |
| Clustering & temporal data mining | Agglomerative hierarchical & expectation-maximization, process & sequence mining |
| Rodriguez et al. (2014) | PLE trace data |
| Temporal data mining | Process mining |
| Wong et al. (2019) | MOOC trace data |
| Temporal data mining | Sequential pattern mining using equivalence classes |
| Kinnebrew et al. (2013) | Betty’s Brain system trace data |
| Temporal data mining | Differential sequence mining |
| Cerezo et al. (2020) | LMS trace data |
| Temporal data mining | Inductive miner |
| Yu et al. (2018) | LMS trace data |
| Temporal data mining | Neural networks (LSTM, RNN, & GRU) |
| Di Mitri et al. (2016) | Multimodal data |
| Classification | Regression analysis |
| Bosch et al. (2018) | LMS trace data |
| Classification | Logistic regression |
| Syuhada et al. (2020) | Trace data |
| Classification | K-nearest neighbor |
| Trevors et al. (2016) | Multimodal data & self-report data |
| Statistical modeling | Correlation analysis |
| Montgomery et al. (2019) | LMS trace data |
| Statistical modeling | Association & correlational analysis |
| Jansen et al. (2020) | MOOC trace data & self-report data |
| Statistical modeling | Statistical modeling |
| Jo et al. (2016) | LMS trace data & self-report data |
| Statistical modeling | Statistical modeling |
| Rodriguez et al. (2019) | LMS trace data & self-report data |
| Statistical modeling | Binomial regression |
| Crossley et al. (2016) | MOOC trace data |
| natural language processing (NLP) tools | WAT, TAALES, TAACO, ReaderBench, & SEANCE |
The EDM algorithms identified from the review can be categorized into clustering algorithms, temporal data mining, and other techniques that include natural language processing (NLP) and classification. These EDM categories are discussed in this section.
Clustering algorithms represent the class of unsupervised machine learning techniques that classify learners into groups based on the similar interaction behaviors inferred from log data. Several clustering algorithms have been identified in this study including expectation-maximization, K-means and agglomerative hierarchical.
Expectation-maximization (EM) has been used to identify SRL behaviors and profile learners into various groups based on interaction behaviors. For example, Bouchet et al. (2013) used EM to identify three clusters of learners from trace data derived from learner behaviors. Similarly, Manzanares et al. (2017) used EM to group learners into three clusters. Since the EM algorithm involves predetermining the number of clusters, Manzanares et al. (2017) used the bi-stage cluster node to determine the value of k. Additionally, Matcha et al. (2019) investigated how EM can cluster students based on learning sequences which were also used to identify the SRL strategies based on the indicators learners used. The agglomerative hierarchical was utilized to identify learning patterns from the SRL strategies identified from the clusters (Matcha et al., 2019). In this study, various learning behaviors were identified: reading-oriented students, exercise-oriented students, and students oriented toward MCQs and video. Other students exhibited diverse behaviors such as the use of exercises, video views, and MCQs in learning. Three groups of learners were identified: high-, moderate-, and low-level SRL engagers.
The K-means clustering algorithm was used in a number of studies. The K-means algorithm iteratively divides a given dataset into a number of distinct number of clusters. The value of k therefore represents the number of dissimilar clusters identified from a dataset. The data points in each cluster are similar to each other and dissimilar from data points in other clusters (Nuankaew et al., 2019). In their study, Zheng et al. (2020) employed the K-means clustering algorithm to identify profiles in SRL for learners taking STEM courses in engineering design. In this study, principle component analysis was used to reduce the high-dimensionality of the data (Zheng et al., 2020). Given that K-means is an unsupervised machine learning algorithm, the number of clusters needed to be pre-determined; the ball statistic was used to establish the optimal number of clusters. The clusters identified in that study included competent self-regulated learners, minimally self-regulated learners, cognitive-oriented self-regulated learners, and reflective self-regulated learners. However, the study had limitations. For one, the indicators of the SRL were based on an Energy 3D learning environment that is specifically used by engineering students. The study therefore may not be applicable across other non-engineering courses and programs. Similarly, Valdiviezo et al. (2013) used the k-means algorithm to identify three clusters: high, medium, and minimal access and usage levels, based on students’ online interaction behaviors from virtual learning interaction (VLI) data from the Moodle LMS. The highest level of self-regulated learners, according to the study, were those students who had the greatest amount of interaction on forums, in terms of responding, viewing and adding discussions, quizzes, reading and writing messages, and accessing online learning resources. The k-means gives accurate results for similar experiments in the area of modelling student learning behaviors (Valdiviezo et al., 2013). Finally, Kizilcec et al. (2013) used k-means to identify groups of learners based on engagement behaviors as measured from trace data collected on a MOOC platform.
The agglomerative hierarchical algorithm, which helps to identify an unknown number of clusters given variables of interest from datasets, was also identified in the review. For example, Sun et al. (2016) investigated the effect of SRL on performance trajectory in a flipped classroom using the agglomerative hierarchical clustering algorithm. Six trajectory groups based on students’ performance and trace data from interactions on the LMS were identified. The agglomerative hierarchical algorithm has also been used in other studies to identify distinct groups of learners based on their SRL variables as reported using an MSLQ self-report tool (Pardo et al., 2016, 2017). The groups were then used to investigate the association between the students’ online activity interactions and academic performance. Additionally, agglomerative hierarchical, based on Ward’s method, was used to identify profiles of learners from trace data (Cicchinelli et al., 2018).
Temporal data mining encompasses two main techniques: process mining and sequence mining. A process mining algorithm is used to describe the paths followed by learners in an online learning environment (Rodriguez et al., 2014). Sequential mining on the other hand is used to identify sequences of learning activities using learner interaction logs. The objective is to determine the path followed by online students and the frequency of the activities carried out by the students (Wong et al., 2019). Sequence mining and process mining have been used to identify learning paths especially on MOOC platforms. Process mining is usually carried out before sequence mining. This helps generate process models that are based on students’ time-stamped actions captured during the learning process. The sequence of learning actions that students perform during a learning episode will help understand the path followed by learners. The output is exploited for cluster analysis (Matcha et al., 2019).
In the review, several studies used process and sequence mining to investigate the presence of SRL strategies detected in trace data from both MOOCs and LMSs. For example, Cerezo et al. (2020) used process mining to measure SRL process from students’ interaction data generated from the Moodle LMS. The inductive miner algorithm was used to produce process models that demonstrated students’ learning behaviors. The process models reproduced students’ interaction on the LMS. In that study, the highly regulated students were found to have followed the learning paths suggested by the instructor. This group of learners also performed activities related to forum discussions. In a related study, Kinnebrew et al. (2013) used differential sequence mining to identify and classify learners into groups based on their behaviors. Sequence mining requires that the trace data, which contain student interaction logs that indicate students’ learning patterns, is first transformed into a sequence of actions. In this study, sequence mining was used to identify frequent patterns from a set of sequences. The indicators captured by Betty’s Brain, a software agent, included read, edit, query, explain, and quiz. The algorithm analyses the sequence of actions and classifies learners into three groups: high, low, and medium engagers. Likewise, Maldonado-Mahauad et al. (2018), in their study whose main objective was to identify learning interaction sequences, clustered students with similar behavioral characteristics. Process mining was used to first identify the learning paths followed by learners in a MOOC course. The interaction sequences that were used for exploratory analysis were later used for clustering of learners into profiles. For clustering, agglomerative hierarchical was used to cluster learners according to the interaction sequences they followed. Three groups were identified: sampling learners (low level SRL), as well as comprehensive learners and targeting learners, who exhibited similar SRL behaviors.
Other machine learning algorithms and statistical modeling were also applied on multimodal data to measure the SRL of online learners (Di Mitri et al., 2016, 2017; Trevors et al., 2016). Likewise, statistical modeling, such as association techniques, along with other techniques, such as confirmatory factor analysis, was applied. For example, Crossley et al., 2016 used natural language processing (NLP) tools to complement trace data with language properties in understanding learner behavior especially from forum posts. The indices of NLP that were used included text length, social collaboration, sentiment analysis, text cohesion, syntactic complexity, lexical sophistication, and quality of writing. Classification techniques have also been used to categorize learners according to their learning patterns. For example, logistic regression was used to classify learners into different demographic and underrepresented groups based on trace data collected from an LMS (Bosch et al., 2018). Statistical modeling and frequency of learning activities were also performed so as to better understand various online learning behaviors. For example, Jansen et al. (2020) investigated the levels of compliance to the SRL interventions that were provided to learners by the MOOC. Neural network techniques have also been used to determine the extent to which students’ learning paths conform to the pre-determined course structure. The page clickstream data was used, including the sequence of video interactions, assignment and quiz navigations, welcome page views, and discussion sessions (Yu et al., 2018).
As presented in Table 2, the sources of datasets and the features sets used for profiling learners based on behavior patterns were also investigated. A majority of the studies used trace data collected from LMSs such as Moodle (Cerezo et al., 2020; Jo et al., 2016; Manzanares et al., 2017; Montgomery et al., 2019; Sun et al., 2016; Valdiviezo et al., 2013), and Canvas (Park et al., 2018; Rodriguez et al., 2019). In measuring SRL and identifying SRL profiles, some studies relied on trace data in MOOCs such as those offered at the Coursera website (Crossley et al., 2016; Jansen et al., 2020; Kizilcec et al., 2013; Maldonado-Mahauad et al., 2018; Wong et al., 2019). Other online learning environments included Energy 3D (Zheng et al., 2020), Betty’s Brain (Kinnebrew et al., 2013), and LON-CAPA (Bosch et al., 2018). Moreover, datasets collected from agent-based software applications such as MetaTutor, an agent-based system purposely developed to promote SRL, were used to profile and cluster learning according to students’ interaction behaviors in a virtual learning environment (VLE; Bouchet et al., 2013).
The findings reveal that the dataset features used for profiling and measuring SRL in online learning are determined by the type of e-learning environment from which the data was collected. For example, for studies that used LMS data, the indicators include forum-related activities such as posting and updating forums, viewing, and replying to other students’ posts. Other learning activities considered are quiz events such as quiz completion status and submission time in relation to the set deadlines, course module views, writing and reading messages, and the frequency and regularity of student logins (Jo et al., 2016; Montgomery et al., 2019; Valdiviezo et al., 2013). For trace data from MOOCs, learning activities related to video interactions such as video views and reviews, quiz events, assignment attempts and reviews, and course completion status were considered (Jansen et al., 2020; Kizilcec et al., 2013; Maldonado-Mahauad et al., 2018; Wong et al., 2019). Some researchers used multimodal data to measure SRL (Di Mitri et al., 2016, 2017; Trevors et al., 2016).
The main objective of the systematic review was to identify the EDM techniques that are currently being used to measure SRL using trace data from online learning environments. The results reveal that clustering algorithms are more commonly used as compared to temporal data mining and classification algorithms. Our findings agree with the results obtained from a previous review (Elsayed et al., 2019). The study also revealed that the EDM algorithms currently being used in measuring and profiling SRL in online learning environments include expectation-maximization (Bouchet et al., 2013; Manzanares et al., 2017; Matcha et al., 2019), k-means (Çebi & Güyer, 2020; Kizilcec et al., 2013; Li et al., 2018; Valdiviezo et al., 2013; Yot-Domínguez & Marcelo, 2017; Zheng et al., 2020), agglomerative hierarchical (Cicchinelli et al., 2018; Maldonado-Mahauad et al., 2018; Matcha et al., 2019; Sun et al., 2016), and process mining (Kinnebrew et al., 2013; Matcha et al., 2019; Rodriguez et al., 2014; Wong et al., 2019). Classification algorithms that have been used in the reviewed studies include k-nearest neighbor (Syuhada et al., 2020), neural networks (Yu et al., 2018) and logistic regression (Bosch et al., 2018).
From the review, it can be established that SRL dataset features from online learning environments could potentially be influencing the type of algorithm used to profile learners based on their SRL skills. For example, it can be observed that process and sequence mining were mostly applied on datasets collected from MOOCs and PLEs where the feature sets considered were the video interaction events, quiz, and assignment type and submissions timelines (Kinnebrew et al., 2013; Matcha et al., 2019; Rodriguez et al., 2014; Wong et al., 2019). On the other hand, clustering algorithms were mostly applied on LMS data where the feature sets such as module and page views, login frequency and regularity, and assignment and quiz views and scores were mostly considered (Cicchinelli et al., 2018; Jo et al., 2016; Manzanares et al., 2017; Montgomery et al., 2019; Park et al., 2018; Sun et al., 2016; Valdiviezo et al., 2013).
From the review, it can be argued that there is no empirical evidence that shows which EDM algorithm for profiling SRL using online learning datasets is optimal. The experimental evaluation carried out in the next section was therefore conducted with the objective of establishing the optimal EDM algorithm for profiling learners according to their course interaction behaviors.
In this section, we describe the experiment carried out to compare the clustering algorithms identified from the systematic review. The algorithms identified from the literature review were compared to determine the optimal number of clusters formed by the best performing algorithm. For research questions two and three, a dataset collected from a virtual learning environment at the Open University in the UK was applied to the algorithms identified to profile learners into clusters and also test for any association between SRL profiles and academic performance.
The dataset collected from the Open University in the UK was used to identify the optimal clustering algorithm and the optimal number of clusters in online learning. The Open University Learning Analytics Dataset (OULAD) was chosen for this study as it represents students’ actual behaviors in an online LMS as compared to other sets of data (Jha et al., 2019). The dataset contains three categories of student information: demographic, interactions in the form of logs, and assessments. The dataset is organized in tabular form with seven files. The data represents 22 courses and 32,593 students, their assessment results, and their interactions with a virtual learning environment (VLE) (Kuzilek et al., 2017). The current study used the dataset extracted from the studentInfo, vle, and studentVle tables (N = 735). The dataset represents students’ interactions in one course offered in two semesters. The interactions are represented by the number of clicks/visits to specific learning resources and activities, such as course notes in the form of HTML pages and pdf files, and learning activities in the form of discussion forums and quizzes (Kuzilek et al., 2015). According to Kuzilek et al. (2017), the resources that were being accessed by the students included the course homepage, external and internal URLs, course subpages, resources, discussion forums, a glossary, collaboration tools, and course content. Table 3 presents a summary of the OULAD dataset and its features (Kuzilek et al., 2017).
Table 3
Summary of the Open University Learning Analytics Dataset
| Table name | Records, n | Description | Table attributes |
| courses | 22 | Information about the courses | code_module, code_presentation, module_presentation_length |
| studentInfo | 32,593 | Demographic information about the students | code_module, code_presentation, id_student, gender, region, highest_education, imd_band, age_band, num_of_prev_attempts, studied_credits, disability, final_result |
| studentRegistration | 32,593 | Registration of the student for a course presentation | code_module, code_presentation, id_student, date_registration, date_unregistration |
| assessments | 196 | Assessments for every course presentation | code_module, code_presentation, id_assessment, assessment_type, date, weight |
| studentAssessments | 173,740 | Assessments submitted by the students | id_assessment, id_student, date_submitted, is_banked, score |
| vle | 6,365 | Online learning resources and materials | id_site, code_module, code_presentation, activity_type, week_from, week_to |
| studentVle | 1,048,575 | Student interaction with the VLE resources | code_module, code_presentation, id_student, id_site, date, sum_click |
After feature extraction, which was done using id_student, code_module and code_presentation as unique identifiers from three files that included studentVle, studentInfo and courses, one file was generated containing 5 columns and 735 rows. The extracted file contained one course named AAA, which was offered in two separate semesters to two separate cohorts one in 2013 and another in 2014 represented by 2013J and 2014J. Table 4 presents a summary of the sample dataset obtained for experimental evaluation. The sum of clicks captured students’ interactions with various resources stored on the VLE. The clickstream data, which is also referred as number/sum of clicks in this study, represents the number of interactions students made when accessing various learning activities and resources.
Table 4
Summary of the Preprocessed Sample OULAD Dataset for Module AAA
| Semester | Student ID | Sum of clicks | Final results |
| 2013J | 100893 | 744 | Pass |
| 2014J | 258587 | 6,609 | Distinction |
| 2014J | 2606802 | 306 | Fail |
| 2013J | 101781 | 4,104 | Pass |
| 2013J | 129955 | 1,011 | Withdrawn |
| 2013J | 102806 | 1,944 | Pass |
| 2013J | 146188 | 597 | Fail |
| 2013J | 102952 | 1,150 | Pass |
| 2013J | 147793 | 155 | Withdrawn |
| 2014J | 263251 | 2,485 | Pass |
| 2013J | 1035023 | 1,896 | Pass |
| 2014J | 268733 | 3 | Fail |
The preprocessed data was then imported to a Python environment where various clusters were formed using the three algorithms: k-means, expectation-maximization, and agglomerative hierarchical. The algorithms were implemented for clustering and visualization in the RStudio environment where the statistical evaluations were computed.
First, the Python programming language was used to visualize scatterplots for the clusters formed by the three algorithms being compared, where the number of clusters was varied from 3 to 10 for each algorithm. Secondly, the clusters formed were compared using internal validation indices provided by the clValid (Brock et al., 2008) and the NbClust (Charrad et al., 2014) R packages. The functions were used to compare the algorithms based on the internal information of the data by evaluating the “goodness” and quality of the clusters formed. The outputs from the evaluations were used to determine the optimal number of clusters and the best performing algorithm (Rodriguez et al., 2019; Van-Craenendonck & Blockeel, 2015). The clValid uses the Dunn index, Connectivity, and the Silhouette index to establish the optimal number of clusters and the best performing algorithms (Brock et al., 2008). The NbClust, on the other hand, determines the optimal number of clusters in the dataset using the results of 30 inbuilt indices (Charrad et al., 2014).
In this section, experimental results for the three clustering algorithms are discussed. First, we examine the results of the three clustering algorithms. Second, the clustering evaluation carried out to determine the most appropriate algorithm with the optimal number of clusters is described. Last, we present the results of the test for independency between the optimal clusters and students’ final academic achievement.
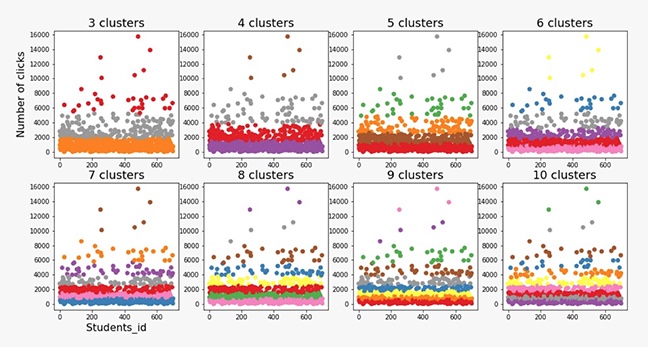
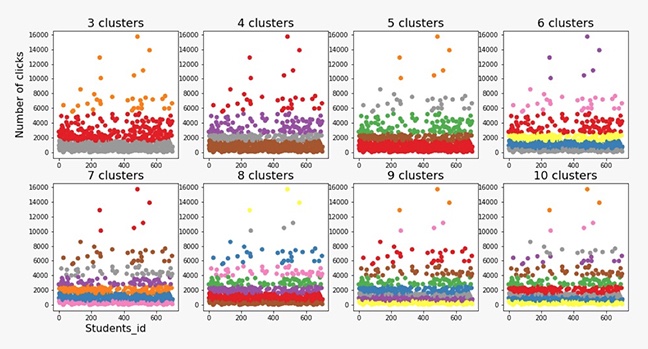
As presented in Figures 1, 2, and 3, the scatterplots demonstrate the clusters formed by the K-means, expectation-maximization, and agglomerative hierarchical algorithms while varying the number of clusters from 3 to 10.
Figure 1
Clustering Using the K-Means Algorithm
Figure 2
Clustering Using the Expectation Maximization Algorithm
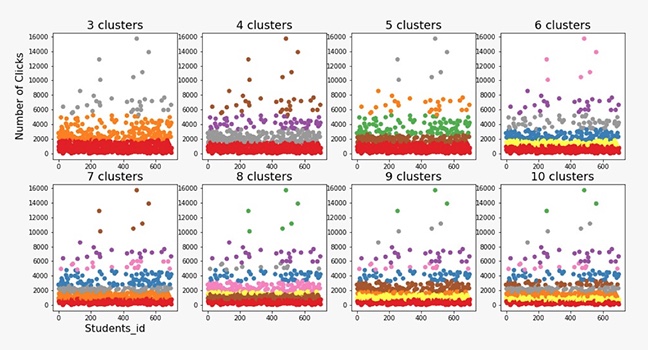
Figure 3
Clustering Using the Agglomerative Hierarchical Clustering Algorithm
After the clusters were formed by the algorithms, an evaluation was carried out using the clValid R package that compared the cluster results and gave the optimal scores for the best performing algorithm (Brock et al., 2008). The results are presented in Table 5.
Table 5
Optimal Algorithm and Cluster Evaluation Results
| Algorithm | Validation measure | Number of clusters | |||||||
| 3 | 4 | 5 | 6 | 7 | 8 | 9 | 10 | ||
| Agglomerative hierarchical | Connectivity | 8.4552 | 12.0135 | 20.7044 | 22.9044 | 25.9333 | 30.7552 | 43.1417 | 47.5131 |
| Dunn | 0.0576 | 0.0609 | 0.0299 | 0.0299 | 0.0312 | 0.0356 | 0.0223 | 0.0250 | |
| Silhouette | 0.7111 | 0.7095 | 0.6116 | 0.6110 | 0.6024 | 0.5472 | 0.5054 | 0.5110 | |
| K-means | Connectivity | 12.9540 | 27.7000 | 42.8472 | 45.3774 | 47.5774 | 65.5869 | 74.4853 | 65.5829 |
| Dunn | 0.0135 | 0.0075 | 0.0057 | 0.0131 | 0.0131 | 0.0082 | 0.0061 | 0.0185 | |
| Silhouette | 0.6571 | 0.5650 | 0.5443 | 0.5326 | 0.5316 | 0.4892 | 0.4615 | 0.4633 | |
| Expectation-maximization | Connectivity | 37.7675 | 47.3556 | 55.5512 | 62.8067 | 73.1829 | 86.7683 | 114.7929 | 128.2321 |
| Dunn | 0.0009 | 0.0018 | 0.0017 | 0.0030 | 0.0023 | 0.0047 | 0.0026 | 0.0026 | |
| Silhouette | 0.5278 | 0.4491 | 0.4616 | 0.4709 | 0.4613 | 0.4062 | 0.3597 | 0.3551 | |
Note. The optimal score value for Connectivity, which identifies the optimal number of clusters with lowest score and Dunn index and Silhouette which identifies the optimal number clusters with highest score are in bold (Brock et al., 2008).
The results indicate that the agglomerative hierarchical algorithm is the best performing with the optimal score of 8.4552 for Connectivity and 0.7111 for Silhouette measures when there are 3 optimal clusters. However, the Dunn index proposes 4 optimal clusters with optimal score of 0.0609. We also evaluated the clusters using the NbClust function. The NbClust function provides 30 internal validation indices that allow simultaneous evaluation of algorithms in order to determine the optimal number of clusters for a given dataset (Charrad et al., 2014). From these 30 indices, seven proposed 3 as the optimal number of clusters, fifteen proposed 4 clusters, while two proposed 5 clusters. The rest of the indices, such as the Dindex and Hubert, gave graphical results. They also indicated 4 clusters would be optimal. Based on the majority rule, we conclude that the best number of clusters in the dataset would be 4.
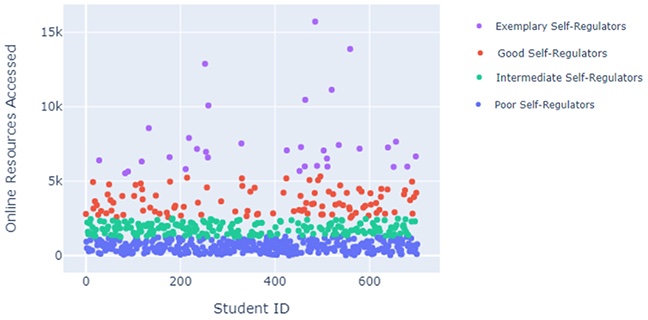
After the experimental evaluation of the clusters formed by agglomerative hierarchical clustering, it was revealed that the students’ interaction data could optimally be categorized into four distinct clusters. The clusters seen in the dataset included:
The classification of students into four profiles was based on behavioral activities that represented the number of resources accessed. The resources included homepage, subpages, external and internal URLs, discussion forums, course content, assignments, and course content. The SRL profiles were identified using the agglomerative hierarchical clustering algorithm. Using exploratory data analysis, the clusters formed were mapped onto four SRL profiles: exemplary self-regulators, good self-regulators, intermediate self-regulators, and poor self-regulators. These are illustrated on the scatterplot in Figure 4.
Figure 4
Clusters Mapped on to SRL Profiles
The original dataset included the final results of the students. Based on these results, it was possible to identify the distribution of clusters among students who had passed with distinction, passed, failed, or withdrawn. The exemplary and good self-regulators had the highest number of clickstream interactions and performed the best in terms of the final grades. The students in these two profiles either had a distinction or a pass in their final results. As presented in Figure 5A, among students who passed, 35.11% were intermediate self-regulators while 16.81% and 4.89% were good and exemplary regulators respectively. Among the students who passed with distinction, good and exemplary self-regulators represented the highest percentage at 20.93% and 32.56% respectively as illustrated in Figure 5B. The number of poor and intermediate self-regulators found among the students who had passed with distinction reveals that there could be other factors contributing to their academic performance. As shown in Figure 5B and 5C, the poor and intermediate self-regulators had a low to medium number of clickstream interactions. The majority of the students in these groups exhibited similar academic results. They either failed or withdrew from the course. It can also be observed that some students who were classified as good or exemplary self-regulators withdrew from or failed the course. This implies that there could be external factors that influenced their academic performance. Lastly, as shown in Figure 5D, among the students who withdrew, 73.33% were poor self-regulators while 19.05% represented the intermediate self-regulators.
Figure 5
Distribution of SRL Profiles Among Students Based on Their Final Results

Note. N of students = 735. Panel A: Students who passed. Panel B: Students who passed with distinction. Panel C: Students who failed. Panel D: Students who withdrew.
The chi-square test was carried out to establish the correlation between the SRL profiles formed by the agglomerative hierarchical clustering algorithm and students’ final results. A contingency table was computed from the values of the distribution of students among the four clusters of SRL profiles and the four categories of the students’ final results: passed with distinction, passed, failed, and withdrew. The computed p -value was 0.00 (8.988568648725134e-22). When the p-value obtained is compared with the alpha value of 0.05, since p < 0.05, we can conclude that there is a significant relationship between the SRL profiles and the students’ final results.
In this research, two related studies were carried out. First, a review of the literature describing EDM techniques for identifying profiles in SRL was undertaken. The results from the review indicate that a clustering technique is the most appropriate, preferred over other techniques such as temporal data mining, natural language processing, neural networks, and classification. It was observed that clustering was most often the most appropriate technique when using online educational datasets from LMSs. The findings led us to conduct the second study which aimed at experimenting with the clustering techniques such that three algorithms were compared: k-means, agglomerative hierarchical clustering, and expectation-maximization. The clustering algorithms were evaluated using internal validation measures to identify the optimal algorithms and number of clusters. The findings demonstrate that agglomerative hierarchical clustering is the best performing algorithm. These findings align with results from previous studies (Çebi and Güyer, 2020; Gašević et al., 2017). Cluster evaluation was carried out to establish the optimal algorithm with an optimal number of clusters. Using the NbClust function, where 30 inbuilt indices were used to simultaneously compare the clusters, fifteen indices proposed 4 clusters while seven indices proposed 3 clusters. Based on the majority rule, we concluded that the optimal number of clusters is four (Charrad et al., 2014). Furthermore, an exploration and analysis of the clusters formed by the optimal clustering algorithm, agglomerative hierarchical, indicate that four SRL profiles existed in the online dataset collected from a virtual learning environment. The four clusters were further examined and mapped onto four SRL profiles based on the learners’ behaviors as inferred from the OULAD dataset.
The SRL profiles identified include exemplary self-regulators, good self-regulators, intermediate self-regulators, and poor self-regulators. The SRL clusters differed from each other in terms of the frequency of the sum of clicks which represents the clickstream interactions students had with online learning resources such as course homepage, external and internal URLs, course subpages, resources, discussion forums, glossary, collaboration tools, and course content. Additionally, since the OULAD dataset included students’ final results, it was possible to identify the distribution of each of the profiles among the students who had distinction, pass, fail, or withdrawn. It was observed that the exemplary and good self-regulators had the highest number of clickstream interactions, i.e., above 2,500. The intermediate self-regulators had a medium number of clicks that ranged from 1,000 to 2,500, while poor self-regulators had the lowest number, i.e., below 1,000. The distribution of students in the various profiles also indicates that a majority of the poor and intermediate self-regulators either failed or withdrew from the course.
Finally, a test of independence to establish the relationship between the SRL profiles and the students’ final results revealed a significant relationship between the two categorical variables. Profiling students according to their SRL skills helps instructors in identifying learners with similar interaction behaviors. These SRL profiles may be helpful in developing and providing customized and targeted interventions based of each group’s characteristics.
Online learners differ in terms of the behaviors they exhibit during online learning. Identifying existing behavior groups will help educators provide targeted SRL interventions instead of offering one-size-fits-all treatments to students. While any algorithm can be applied to determine the number of clusters available in a given dataset, any algorithm may fail to identify the optimal number of clusters given differences in datasets. For example, datasets from educational environments differ from datasets obtained from other industries. Additionally, our review of literature revealed little knowledge exists about the most appropriate algorithm to use with datasets from online learning environments such as LMSs. This study sought to solve this problem from three perspectives: (a) the most appropriate EDM techniques being applied in identifying SRL profiles, (b) the best performing algorithm, and (c) the optimal number of SRL profiles available in trace data collected from an online learning environment.
The current study has provided insights into the identification of SRL profiles using EDM techniques such as clustering algorithms in online learning environments. The OULAD dataset was applied to the experimental comparison of the algorithms. The findings revealed that it is now possible for SRL interventions to be targeted to the right groups, based on learners’ behavioral characteristics. This will enhance students’ abilities in terms of SRL skills which have been found to be poor in most online learners (Goda et al., 2020). Moreover, given the large number of students enrolling in online learning and the limited number of instructors, it will be necessary to use EDM techniques to identify SRL profiles which can then be used to establish the nature and level of student interactions in online learning environments such as an LMS (Goda et al., 2020).
The findings from this study imply that EDM techniques offer great opportunities for researchers to use trace data collected from online learning environments to explore supporting SRL. Profiling learners according to their SRL strategies will be a first step in providing targeted SRL interventions. The findings from this study offer insights into two areas: first, that EDM techniques can be used to identify learner profiles in terms of SRL skills in open and distributed learning environments. Second, clustering students based on their levels of self-regulation provide a means of understanding where online learners are situated so as to develop guidance and support aligned to learners’ needs hence offering the opportunity for instructors to provide targeted interventions for each of the formed clusters. The results from this study also contribute to the measuring of SRL in online learning environments by giving insights into how to build machine learning models that can ultimately be used to provide SRL interventions.
The findings concerning the association between SRL profiles and students’ final results were based on correlation analysis. The results may therefore have failed to reveal all the intervening factors that could have contributed to the success or failure of the online learners. It would therefore be interesting for future studies to consider variables other than clickstream interaction behavior that could affect the clusters. Given that this current study did not consider specific SRL strategies such as time management, help-seeking, elaboration, and rehearsal, and how they could be inferred from the trace data, an empirical study could be carried out to profile learners based on identifying specific SRL strategies and examining how they could be measured, monitored, and even promoted in an actual online learning environment (Araka et al., 2021). Finally, we propose that future studies could examine how targeted interventions could be designed to promote SRL strategies based on learner needs in each SRL profile. For example, it would be interesting to investigate how EDM algorithms could be integrated into an LMS to enable real-time profiling of learners, thus providing SRL interventions to stimulate the growth of self-regulatory skills especially for poor self-regulators. Early identification and intervention will help learners with such low self-regulatory skills. We are currently carrying out an empirical study to establish whether SRL interventions provided through real-time analysis of educational data in a live LMS can improve students’ learning processes and consequently advance the knowledge and behavior of learners.
This research was supported by the National Research Fund 2016/2017 grant award under the multidisciplinary-multi-institutional category to a consortium led by Kenyatta University and involving the University of Nairobi and The Cooperative University of Kenya.
Ainscough, L., Leung, R., Colthorpe, K., & Langfield, T. (2019). Characterizing university students’ self-regulated learning behavior using dispositional learning analytics. In J. Domenech, P. Merello, E. de la Poza, D. Blazquez, & R. Peña-Ortiz (Eds.), Fifth international conference on higher education advances (HEAd’19) (pp. 233-241). Editorial Universitat Politècnica de València. https://doi.org/10.4995/head19.2019.9153
Aljohani, N. R., Fayoumi, A., & Hassan, S.-U. (2019). Predicting at-risk students using clickstream data in the virtual learning environment. Sustainability, 11(24), 7238. https://doi.org/10.3390/su11247238
Alshabandar, R., Hussain, A., Keight, R., Laws, A., & Baker, T. (2018). The application of Gaussian mixture models for the identification of at-risk learners in massive open online courses. In 2018 IEEE congress on evolutionary computation (CEC 2018) (pp. 1-8). IEEE. https://doi.org/10.1109/CEC.2018.8477770
Araka, E., Maina, E., Gitonga, R., & Oboko, R. (2020). Research trends in measurement and intervention tools for self-regulated learning for e-learning environments—Systematic review (2008-2018). Research and Practice in Technology Enhanced Learning, 15(1), Article 6. https://doi.org/10.1186/s41039-020-00129-5
Araka, E., Maina, E., Gitonga, R., Oboko, R., & Kihoro, J. (2021). University students’ perception on the usefulness of learning management system features in promoting self-regulated learning in online learning. International Journal of Education and Development Using Information and Communication Technology (IJEDICT), 17(1), 45-64. http://ijedict.dec.uwi.edu/viewarticle.php?id=2850
Araka, E., Oboko, R., Maina, E., & Gitonga, R. (2020). A conceptual educational data mining model for supporting self-regulated learning in online learning environments. In J. Keengwe & Y. Tran (Eds.), Handbook of research on equity in computer science in P-16 education (pp. 278-292). IGI Global. https://doi.org/10.4018/978-1-7998-4739-7.ch016
Azevedo, R. (2009). Theoretical, conceptual, methodological, and instructional issues in research on metacognition and self-regulated learning: A discussion. Metacognition and Learning, 4(1), 87-95. https://doi.org/10.1007/s11409-009-9035-7
Barnard-Brak, L., Paton, V. O., & Lan, W. Y. (2010). Profiles in self-regulated learning in the online learning environment. International Review of Research in Open and Distributed Learning, 11(1), 55-78. https://doi.org/10.19173/irrodl.v11i1.769
Bosch, N., Crues, W., Henricks, G., Perry, M., Angrave, L., Shaik, N., Bhat, S., & Anderson, C. (2018). Modeling key differences in underrepresented students’ interactions with an online STEM course. In A. L. Story (Chair), Proceedings of the Technology, Mind, and Society conference 2018: TechMindSociety ’18, 1-6. https://doi.org/10.1145/3183654.3183681
Bouchet, F., Harley, J. M., Trevors, G. J., & Azevedo, R. (2013). Clustering and profiling students according to their interactions with an intelligent tutoring system fostering self-regulated learning. Journal of Educational Data Mining, 5(1), 104-146. https://doi.org/10.5281/zenodo.3554613
Broadbent, J., & Poon, W. L. (2015). Self-regulated learning strategies and academic achievement in online higher education learning environments: A systematic review. The Internet and Higher Education, 27, 1-13. https://doi.org/10.1016/j.iheduc.2015.04.007
Broadbent, J., & Fuller-Tyszkiewicz, M. (2018). Profiles in self-regulated learning and their correlates for online and blended learning students. Educational Technology Research and Development, 66, 1435-1455. https://doi.org/10.1007/s11423-018-9595-9
Brock, G., Pihur, V., Datta, S., & Datta, S. (2008). ClValid: An R package for cluster validation. Journal of Statistical Software, 25(4), 1-22. https://doi.org/10.18637/jss.v025.i04
Çebi, A., & Güyer, T. (2020). Students’ interaction patterns in different online learning activities and their relationship with motivation, self-regulated learning strategy and learning performance. Education and Information Technologies, 25, 3975-3993. https://doi.org/10.1007/s10639-020-10151-1
Cerezo, R., Bogarín, A., Esteban, M., & Romero, C. (2020). Process mining for self-regulated learning assessment in e-learning. Journal of Computing in Higher Education, 32(1), 74-88. https://doi.org/10.1007/s12528-019-09225-y
Cerezo, R., Sánchez-Santillán, M., Paule-Ruiz, M. P., & Núñez, J. C. (2016). Students’ LMS interaction patterns and their relationship with achievement: A case study in higher education. Computers & Education, 96, 42-54. https://doi.org/10.1016/j.compedu.2016.02.006
Charrad, M., Ghazzali, N., Boiteau, V., & Niknafs, A. (2014). NbClust: An R package for determining the relevant number of clusters in a data set. Journal of Statistical Software, 61(6), 1-36. https://doi.org/10.18637/jss.v061.i06
Cicchinelli, A., Veas, E., Pardo, A., Pammer-Schindler, V., Fessl, A., Barreiros, C., & Lindstädt, S. (2018). Finding traces of self-regulated learning in activity streams. In A. Pardo, K. Bartimote-Aufflick, & G. Lynch (Chairs), LAK ’18: Proceedings of the eighth international conference on learning analytics and knowledge (pp. 191-200). ACM. https://doi.org/10.1145/3170358.3170381
Coman, C., Țîru, L. G., Meseșan-Schmitz, L., Stanciu, C., & Bularca, M. C. (2020). Online teaching and learning in higher education during the coronavirus pandemic: Students’ perspective. Sustainability (Switzerland), 12(24), 1-22. https://doi.org/10.3390/su122410367
Crossley, S., Mcnamara, D., Paquette, L., Baker, R., & Dascalu, M. (2016). Combining click-stream data with NLP tools to better understand MOOC completion. In D. Gašević & G. Lynch (Chairs), LAK ’16: Proceedings of the sixth international conference on learning analytics and knowledge (pp. 6-14). ACM. https://doi.org/10.1145/2883851.2883931
Dabbagh, N., & Kitsantas, A. (2005). Using web-based pedagogical tools as scaffolds for self-regulated learning. Instructional Science, 33(5-6), 513-540. https://doi.org/10.1007/s11251-005-1278-3
Di Mitri, D., Börner, D., Scheffel, M., Ternier, S., Drachsler, H., & Specht, M. (2017). Learning pulse: A machine learning approach for predicting performance in self-regulated learning using multimodal data. In A. Wise, P. Winne, & G. Lynch (Chairs), LAK ’17: Proceedings of the seventh international learning analytics and knowledge conference (pp. 188-197). ACM. https://doi.org/10.1145/3027385.3027447
Di Mitri, D., Scheffel, M., Drachsler, H., Borner, D., Ternier, S., & Specht, M. (2016). Learning pulse: Using wearable biosensors and learning analytics to investigate and predict learning success in self-regulated learning. In R. Martinez-Maldonado, D. Hernandez-Leo (Eds), Proceedings of the First International Workshop on Learning Analytics Across Physical and Digital Spaces co-located with 6th International Conference on Learning Analytics & Knowledge (LAK 2016) (pp. 34-39). http://ceur-ws.org/Vol-1601/CrossLAK16Paper7.pdf
Elsayed, A., Caeiro-Rodríguez, M., Mikic-Fonte, F., & Llamas-Nistal, M. (2019). Research in learning analytics and educational data mining to measure self-regulated learning : A systematic review. In Proceedings of world conference on mobile and contextual learning 2019 (pp. 46-53). https://www.learntechlib.org/p/210600/
Gašević, D., Jovanović, J., Pardo, A., & Dawson, S. (2017). Detecting learning strategies with analytics: Links with self-reported measures and academic performance. Journal of Learning Analytics, 4(2), 113-128. https://doi.org/10.18608/jla.2017.42.10
Goda, Y., Kato, H., Yamada, M., Saito, Y., Matsuda, T., & Miyagawa, H. (2020). From adaptive learning support to fading out support for effective self-regulated online learning. In D. Glick, A. Cohen, & C. Chang (Eds.), Early warning systems and targeted interventions for student success in online courses (pp. 218-238). IGI Global. https://doi.org/10.4018/978-1-7998-5074-8
Jansen, R., Leeuwen, A., Janssen, J., Conijn, R., & Kester, L. (2020). Supporting learners’ self-regulated learning in massive open online courses. Computers & Education, 146, Article 103771. https://doi.org/10.1016/j.compedu.2019.103771
Jha, N. I., Ghergulescu, I., & Moldovan, A. N. (2019). OULAD MOOC dropout and result prediction using ensemble, deep learning and regression techniques. In H. Lane, S. Zvacek, & J. Uhomoibhi (Eds.), Proceedings of the 11th international conference on computer supported education, Volume 2 (pp. 154-164). https://doi.org/10.5220/0007767901540164
Jo, I., Park, Y., Yoon, M., & Sung, H. (2016). Evaluation of online log variables that estimate learners’ time management in a Korean online learning context. International Review of Research in Open and Distributed Learning, 17(1), 195-213. https://doi.org/10.19173/irrodl.v17i1.2176
Khan, K. S., Kunz, R., Kleijnen, J., & Antes, G. (2003). Five steps to conducting a systematic review. Journal of the Royal Society of Medicine, 96(3), 118-121. https://journals.sagepub.com/doi/pdf/10.1177/014107680309600304
Khanna, L., Narayan Singh, S., & Alam, M. (2016). Educational data mining and its role in determining factors affecting students academic pPerformance: A systematic review. In 2016 1st India international conference on information processing (IICIP) (pp. 1-7). IEEE. https://www.doi.org/10.1109/IICIP.2016.7975354
Kim, D., Yoon, M., Jo, I.-H., & Branch, R. M. (2018). Learning analytics to support self-regulated learning in asynchronous online courses: A case study at a women’s university in South Korea. Computers & Education, 127, 233-251. https://doi.org/10.1016/j.compedu.2018.08.023
Kinnebrew, J., Loretz, K., & Biswas, G. (2013). A contextualized, differential sequence mining method to derive students’ learning behavior patterns. Journal of Educational Data Mining, 5(1), 190-219. https://doi.org/10.5281/zenodo.3554617
Kizilcec, R., Erez-Sanagustín, M. P., & Maldonado, J. (2017). Self-regulated learning strategies predict learner behavior and goal attainment in massive open online courses. Computers & Education, 104, 18-33. https://doi.org/10.1016/j.compedu.2016.10.001
Kizilcec, R., Piech, C., & Schneider, E. (2013). Deconstructing disengagement: Analyzing learner subpopulations in massive open online courses. In D. Suthers, K. Verbert, E. Duval, & X. Ochoa (Eds.), LAK ’13: Proceedings of the third international conference on learning analytics and knowledge (pp. 170-179). ACM. https://doi.org/10.1145/2460296.2460330
Klug, J., Ogrin, S., & Keller, S. (2011). A plea for self-regulated learning as a process: Modelling, measuring and intervening. Psychological Test and Assessment Modeling, 53(1), 51-72.
Kuzilek, J., Hlosta, M., Herrmannova, D., Zdrahal, Z., Vaclavek, J., & Wolff, A. (2015). OU analyse: Analysing at-risk students at The Open University. Learning Analytics Review: LAK15-1, 1-16. http://libeprints.open.ac.uk/42529/
Kuzilek, J., Hlosta, M., & Zdrahal, Z. (2017). Data descriptor: Open University learning analytics dataset. Scientific Data, 4, 1-8. https://doi.org/10.1038/sdata.2017.171
Li, H., Flanagan, B., Konomi, S., & Ogata, H. (2018). Measuring behaviors and identifying indicators of self-regulation in computer-assisted language learning courses. Research and Practice in Technology Enhanced Learning, 13, Article 19. https://doi.org/10.1186/s41039-018-0087-7
Lodge, J. M., & Corrin, L. (2017). What data and analytics can and do say about effective learning. Npj Science of Learning, 2(1), Article 5. https://doi.org/10.1038/s41539-017-0006-5
Madni, H. A., Anwar, Z., & Shah, M. A. (2017). Data mining techniques and applications - A decade review. In J. Zhang (Ed.), 2017 23rd international conference on automation and computing (ICAC) (pp. 1-7). IEEE. https://doi.org/10.23919/IConAC.2017.8082090
Maldonado-Mahauad, J., Pérez-Sanagustín, M., Kizilcec, R., Morales, N., & Munoz-Gama, J. (2018). Mining theory-based patterns from big data: Identifying self-regulated learning strategies in massive open online courses. Computers in Human Behavior, 80, 179-196. https://doi.org/10.1016/j.chb.2017.11.011
Manzanares, M., Sánchez, M., García, O., & Díez-Pastor, J. (2017). How do b-learning and learning patterns influence learning outcomes? Frontiers in Psychology, 8(745), 1-13. https://doi.org/10.3389/fpsyg.2017.00745
Matcha, W., Gašević, D., Uzir, N. A., Jovanović, J., & Pardo, A. (2019). Analytics of learning strategies: Associations with academic performance and feedback. In S. Hsiao, J. Cunningham, K. McCarthy, G. Lynch, C. Brooks, R. Ferguson, & U. Hoppe (Chairs), LAK ’19: Proceedings of the ninth international conference on learning analytics and knowledge (pp. 461-470). ACM. https://doi.org/10.1145/3303772.3303787
Montgomery, A. P., Mousavi, A., Carbonaro, M., Hayward, D. V, Dunn, W., & Montgomery, A. (2019). Using learning analytics to explore self-regulated learning in flipped blended learning music teacher education. British Journal of Educational Technology, 50(1), 114-127. https://doi.org/10.1111/bjet.12590
Nuankaew, W., Nuankaew, P., Teeraputon, D., Phanniphong, K., & Bussaman, S. (2019). Perception and attitude toward self-regulated learning of Thailand’s students in educational data mining perspective. International Journal of Emerging Technologies in Learning, 14(9), 34-49. https://doi.org/10.3991/IJET.V14I09.10048
Pardo, A., Han, F., & Ellis, R. A. (2016). Exploring the relation between self-regulation, online activities, and academic performance: A case study. In D. Gašević, G. Lynch, S. Dawson, H. Drachsler, & C. Penstein Rosé (Chairs), LAK ’16: Proceedings of the sixth international conference on learning analytics and knowledge (pp. 422-429). ACM. https://doi.org/10.1145/2883851.2883883
Pardo, A., Han, F., & Ellis, R. A. (2017). Combining university student self-regulated learning indicators and engagement with online learning events to predict academic performance. IEEE Transactions on Learning Technologies, 10(1), 82-92. https://doi.org/10.1109/TLT.2016.2639508
Park, J., Yu, R., Rodriguez, F., Baker, R., Smyth, P., & Warschauer, M. (2018). Understanding student procrastination via mixture models. In K. E. Boyer & M. Yudelson (Eds.), Proceedings of the 11th international conference on educational data mining (pp. 187-197). International Educational Data Mining Society.
Peach, R. L., Yaliraki, S. N., Lefevre, D., & Barahona, M. (2019). Data-driven unsupervised clustering of online learner behaviour. Npj Science of Learning, 4(1), Article 14. https://doi.org/10.1038/s41539-019-0054-0
Pintrich, P. R. (2004). A conceptual framework for assessing motivation and self-regulated learning in college students. Educational Psychology Review, 16(4), 385-407. https://doi.org/10.1007/s10648-004-0006-x
Rodriguez, A., Vázquez Barreiros, B., Lama, M., Gewerc, A., & Mucientes, M. (2014). Using a learning analytics tool for evaluation in self-regulated learning. Proceedings of the 2014 Frontiers in Education conference (pp. 2484-2491). IEEE. https://doi.org/10.1109/FIE.2014.7044400
Rodriguez, F., Rivas, M. J., Yu, R., Warschauer, M., Park, J., & Sato, B. K. (2019). Utilizing learning analytics to map students’ self-reported study strategies to click behaviors in STEM courses. In S. Hsiao, J. Cunningham, K. McCarthy, G. Lynch, C. Brooks, R. Ferguson, & U. Hoppe (Chairs), LAK ’19: Proceedings of the ninth international conference on learning analytics and knowledge (pp. 456-460). ACM. https://doi.org/10.1145/3303772.3303841
Rodriguez, M. Z., Comin, C. H., Casanova, D., Bruno, O. M., Amancio, D. R., Costa, L. da F., & Rodrigues, F. A. (2019). Clustering algorithms: A comparative approach. PLoS ONE, 14(1), Article e0210236. https://doi.org/10.1371/journal.pone.0210236
Saadati, Z., Zeki, C. P., & Barenji, R. V. (2021, April 29). On the development of blockchain-based learning management system as a metacognitive tool to support self-regulation learning in online higher education. Interactive Learning Environments. https://doi.org/10.1080/10494820.2021.1920429
Schraw, G. (2010). Measuring self-regulation in computer-based learning environments. Educational Psychologist, 45(4), 258-266. https://doi.org/10.1080/00461520.2010.515936
Siemens, G., & Baker, R. (2012). Learning analytics and educational data mining: Towards communication and collaboration. In S. B. Shum, D. Gašević, & R. Ferguson (Chairs), LAK ’12: Proceedings of the second international conference on learning analytics and knowledge (pp. 252-254). ACM. https://doi.org/10.1145/2330601.2330661
Silvola, A., Näykki, P., Kaveri, A., & Muukkonen, H. (2021). Expectations for supporting student engagement with learning analytics: An academic path perspective. Computers & Education, 168, Article 104192. https://doi.org/10.1016/j.compedu.2021.104192
Sun, Z., Lu, L., & Xie, K. (2016). The effects of self-regulated learning on students’ performance trajectory in the flipped math classroom. In C. K. Looi, J. L. Polman, U. Cress, & P. Reimann (Eds.), Transforming learning, empowering learners: The international conference of the learning sciences (ICLS) 2016, Volume 1 (pp. 66-73). International Society of the Learning Sciences. https://www.isls.org/icls/2016/docs/ICLS2016_Volume_1_30June2016.pdf
Syuhada, R., Mawengkang, H., & Lydia, M. S. (2020). Analysis of performances k-nearest neighbor for regulate learning. IOP conference series: Materials science and engineering, 725(3). https://doi.org/10.1088/1757-899X/725/1/012132
Trevors, G., Feyzi-Behnagh, R., Azevedo, R., & Bouchet, F. (2016). Self-regulated learning processes vary as a function of epistemic beliefs and contexts: Mixed method evidence from eye tracking and concurrent and retrospective reports. Learning and Instruction, 42, 31-46. https://doi.org/10.1016/j.learninstruc.2015.11.003
Valdiviezo, P., Reátegui, R., & Sarango, M. (2013). Student behavior patterns in a virtual learning environment. In M. M. Larrondo Petrie, H. Alvarez, I. E. Esparragoza, & C. Rodriguez Arroyave (Eds.), Innovation in engineering, technology and education for competitiveness and prosperity: Proceedings of the 11th Latin American and Caribbean conference for engineering and technology (pp. 1-8). LACCEI. http://www.laccei.org/LACCEI2013-Cancun/RefereedPapers/RP091.pdf
Valle, A., Núñez, C., Cabanach, R., González-Pienda, J., Rodríguez, S., Rosário, P., Cerezo, R., & Muñoz-Cadavid, M. (2008). Self-regulated profiles and academic achievement. Psicothema, 20(4), 724-731. http://www.psicothema.com/pdf/3547.pdf
Van-Craenendonck, T., & Blockeel, H. (2015, June 19). Using internal validity measures to compare clustering algorithms [Poster presentation]. Benelearn, Delft, Netherlands. https://lirias.kuleuven.be/1656512?limo=0
Winne, P., & Baker, R. (2013). The potentials of educational data mining for researching metacognition, motivation and self-regulated learning. Journal of Educational Data Mining, 5(1), 1-8. https://doi.org/10.5281/zenodo.3554619
Wong, J., Baars, M., de Koning, B. B., & Paas, F. (2021). Examining the use of prompts to facilitate self-regulated learning in massive open online courses. Computers in Human Behavior, 115, Article 106596. https://doi.org/10.1016/j.chb.2020.106596
Wong, J., Khalil, M., Baars, M., de Koning, B. B., & Paas, F. (2019). Exploring sequences of learner activities in relation to self-regulated learning in a massive open online course. Computers and Education, 140, Article 103595. https://doi.org/10.1016/j.compedu.2019.103595
Yot-Domínguez, C., & Marcelo, C. (2017). University students’ self-regulated learning using digital technologies. International Journal of Educational Technology in Higher Education, 14, Article 38. https://doi.org/10.1186/s41239-017-0076-8
Yu, R., Jiang, D., & Warschauer, M. (2018). Representing and predicting student navigational pathways in online college courses. In R. Luckin, S. Klemmer, & K. Koedinger (Chairs), L@S ’18: Proceedings of the fifth annual ACM conference on learning at scale (pp. 1-4). ACM. https://doi.org/10.1145/3231644.3231702
Zheng, J., Xing, W., Zhu, G., Chen, G., Zhao, H., & Xie, C. (2020). Profiling self-regulation behaviors in STEM learning of engineering design. Computers & Education, 143, Article 103669. https://doi.org/10.1016/j.compedu.2019.103669
Zimmerman, B. J. (1990). Self-regulated learning and academic achievement: An overview. Educational Psychologist, 25(1), 3-17. https://doi.org/10.1207/s15326985ep2501_2

Using Educational Data Mining Techniques to Identify Profiles in Self-Regulated Learning: An Empirical Evaluation by Eric Araka, Robert Oboko, Elizaphan Maina, and Rhoda Gitonga is licensed under a Creative Commons Attribution 4.0 International License.