Volume 23, Number 1
M. Elena Rodríguez1,2, Ana Elena Guerrero-Roldán1,2, David Baneres1,2, and Abdulkadir Karadeniz2,3
1Faculty of Computer Science, Multimedia and Telecommunications, Universitat Oberta de Catalunya; 2eLearn Center, Universitat Oberta de Catalunya; 3Open Education Faculty, Anadolu University
This work discusses a nudging intervention mechanism combined with an artificial intelligence (AI) system for early detection of learners’ risk of failing or dropping out. Different types of personalized nudges were designed according to educational principles and the learners’ risk classification. The impact on learners’ performance, dropout reduction, and satisfaction was evaluated through a study with 252 learners in a first-year course at a fully online university. Different learners’ groups were designed, with each receiving a different set of nudges. Results showed that nudges positively impacted the learners’ performance and satisfaction, and reduced dropout rates. The impact significantly increased when different types of nudges were provided. Our research reinforced the role of AI as useful in online, distance, and open learning for providing timely learner support, improved learning experiences, and enhanced learner-teacher communication.
Keywords: artificial intelligence, early warning system, nudges, at-risk learners, online learning
Software systems to assist learners and support teachers’ tasks in higher education (HE) have evolved in recent years. HE institutions, particularly fully open and distance universities, have shared their vast expertise about using these systems in a range of educational environments (Castro, 2019). When combined with artificial intelligence (AI) techniques, these software systems have become intelligent systems (Chen et al., 2020) capable of analyzing large educational datasets coming from learning management and other university systems (Siemens & Baker, 2012). Inferred knowledge has enabled educators to make decisions based on evidence, thereby impacting education in different dimensions (Chassignol et al., 2018).
AI-based systems improve learner success and retention by enabling early detection and support of online learners at risk of failing or dropping out; these are key concerns in online learning (Grau-Valldosera et al., 2019). To this end, we developed an adaptive intelligent system (called LIS system) with predictive analytics, a progression dashboard, automated nudges, and recommendations based on AI classification algorithms. There has been considerable research in early detection of at-risk learners. Although predictive models and systems have been proposed (Arnold & Pistilli, 2012; Márquez-Vera et al., 2016; Ortigosa et al., 2019; Vasquez et al., 2015), subsequent support for learners is still an open issue. Our work aimed to develop a nudging intervention mechanism in conjunction with an AI-based system to detect at-risk learners early, and to evaluate the system’s overall impact on learner performance, dropout rates, and student satisfaction.
Nudges are “interventions that preserve freedom of choice that nonetheless influence people’s decisions” (Sunstein, 2015, p. 2). Their effectiveness has been evaluated in health (Bucher et al., 2016), human-computer interaction (Caraban et al., 2019), and across disciplines (Benartzi et al., 2017; Hummel & Maedche, 2019).
In education, recent work (Weijers et al., 2020) has stated that the application of nudging has been sparse, constituting a new research field. Nevertheless, the literature suggested that nudges impact engagement, task completion, and the study of learning resources (Kraft & Rogers, 2015; Martinez, 2014; van Oldenbeek et al., 2019; York et al., 2019). As Mitrovic et al. (2019) noted, nudges foster constructive learning, while Piotrkowicz et al. (2020) discussed the effectiveness of nudges in lifelong e-learning. The systematic review by Damgaard and Nielsen (2018), which included online and distance learning experiences, provided valuable insights: (a) learners appreciate nudges; (b) nudges produce short-term effects; and (c) nudges rarely produce positive effects for all learners.
Overall, these findings suggested that it is better to focus on improving short-end goals that are not behaviors themselves, and that personalized nudges are required. AI allows for such personalization. AI-based systems oriented to support at-risk learners early (Márquez-Vera et al., 2016; Ortigosa et al., 2019; Vasquez et al., 2015) have produced forecasting information, and learners can be nudged through feedforward mechanisms to prevent failure outcomes (i.e., short-term goals). Although there has been discussion about what is considered feedforward (Reimann et al., 2019; Sadler, 2010), it typically refers to future-oriented feedback applied to upcoming assignments. Furthermore, nudges have promoted a learner-teacher relationship that may positively impact learners’ satisfaction and learning outcomes (Ajjawi & Boud, 2018; Eom et al., 2006; Sparks et al., 2015). Therefore, our choice to build a nudging intervention mechanism within the LIS system to complement educational feedback, a cornerstone to support online learners (Martínez-Argüelles et al., 2015), was appropriate.
All educational activity at the Universitat Oberta de Catalunya (UOC) occurs within its virtual campus. Courses are organized in virtual classrooms attended by teachers. The educational model is learner-centered; it provides all learning resources as well as continuous assessment combined with summative evaluation tailored to each course. There are two types of feedback to support learners—general and personalized. General feedback is addressed to all learners who share a virtual classroom, and is provided by teachers through their blackboard, a communication space where the teacher can post relevant information about the course. After each activity is assessed, each learner also receives personalized feedback, together with her mark.
As part of the LIS system, an early warning system (EWS) detects learners at risk of failing or dropping out. The EWS uses AI techniques to detect these learners through their grades for the continuous assessment activities (CAA) and each learner’s profile. The system considers the number of courses the learner has enrolled in, whether she is a new learner, how many times she has enrolled in the course, and her grade point average.
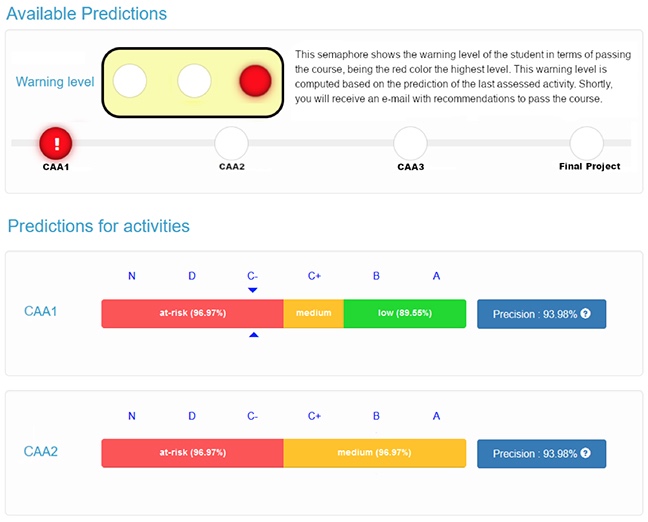
The predictive model is trained with anonymized data from past learners. The predictive model for a course consists of as many submodels as CAAs in the course where the most suitable classification algorithm is applied in terms of accuracy, from among decision tree (DT), k-nearest neighbors (KNN), support vector machine (SVM), and naive Bayes (NB). For each CAA, a prediction is issued. Using the submodel associated with the CAA being analyzed, a simulation detects the minimum grade for a learner to obtain in the next CAA in order to avoid risk of failing. The submodel uses the learners’ profile and her earlier CAA grades to simulate all possible grades for the next CAA, thereby identifying the grade that will change the prediction from fail to pass. This minimum grade is compared with the grade the learner finally obtains for the CAA. Such comparison generates a risk warning level (high, moderate, low) using a green-amber-red semaphore, similar to Arnold and Pistilli (2012). Prediction is personalized because it depends on her profile and previous CAA performance. Each CAA is qualitatively graded (i.e., A, B, C+, C-, or D); grades from C+ to A indicate a pass. The grade N means the learner did not deliver the CAA. Figure 1 shows the progression dashboard for a learner who has received the warning level classification for the first CAA.
Figure 1
Learner’s Progression Dashboard
When the learner is notified about a risk warning level (e.g., high risk of failure because she obtained a C- grade), the risk level distribution for the subsequent CAA is also adjusted. Thus, the learner knows in advance which grades she must obtain in the next CAA in order to pass the course (according to Figure 1, she needs a minimum C+ grade). Both teachers and learners are notified of an at-risk classification, though the main focus is on learners likely to fail, in order to apply interventions to revert the at-risk situation. An in-depth analysis of the EWS is available at Baneres et al. (2020).
Table 1 summarizes the types of messages and nudges supported by our intervention mechanism, as outlined in the classification system proposed by Damgaard and Nielsen (2018). Table 1 also includes information on personalization levels and suggested content. The nudges supported by the intervention mechanism are a consequence of an in-depth analysis of the continuous assessment strategies at UOC and semi-structured interviews with expert teachers.
Messages were linked to each CAA in the course. Two events deal with developing the CAA, while two events are associated with assessing it. The messages were triggered automatically by the system on the teacher’s behalf when certain events and conditions hold, and messages were sent by e-mail from the teacher to the learners.
Informational messages (I1) were associated with beginning the CAA. All learners received the same message (i.e., low personalization is required) containing information about the CAA’s objectives, learning outcomes, and the available learning resources. I1 also highlighted the importance of good planning and urged learners to develop this skill.
Messages could be scheduled, so a few days after the CAA started, learners could be sent a reminder (R1) that the CAA had begun. The degree of personalization was medium because the teacher could set receipt of R1 to only those who have not accessed the virtual classroom since the CAA began. Learners having trouble were prompted to contact the teacher for individualized assistance. Similarly, R2 was sent when the CAA deadline approached. Only learners who had not submitted the CAA received R2, and the teacher specified that the R2 trigger occurred a set number of days before the R2 deadline.
Table 1
Nudges Supported by Intervention System
| CAA stage | Event | Message type | Nudge type | Personalization level | Suggested content |
| CAA development | Beginning | Informational (I1) | Goal setting Informational | Low | CAA in context Available learning resources Advice for goal setting and planning Importance of communication spaces |
| Reminder 1 (R1) | Reminder Social belonging Assistance | Medium | Warning that CAA has started Encourage learner to participate or be aware of communication spaces Boost the learner to contact the teacher in case of problems | ||
| Submission | Reminder 2 (R2) | Warning that CAA deadline is close Submission requirements | |||
| CAA assessment | Solution | Feedback message 1 (FM1) | Informational Goal setting Assistance Extrinsic motivation | Medium | Advice about the CAA solution and alternative solutions Suggestion to improve planning Provide key concepts and competencies for the upcoming CAA Provide learning resources Options to pass the course Teacher assistance |
| Mark | Feedback message 2 (FM2) | Informational Assistance | High | Predictive statement, warning level, and options to pass (feedforward) Teacher assistance |
FM1 was linked to the teacher’s published CAA solution, and it supported medium personalization—the message changed depending on whether the learner submitted the CAA. It was possible to distinguish between learners who simply failed to submit the last CAA and those who had not submitted two or more consecutive CAA. Learners who submitted the CAA received information about using the solution to enhance their learning as well as alternative solutions. Learners were encouraged to compare their answers to the teacher’s solution, ask questions, and review their planning.
Learners who had not submitted the CAA were advised about the key concepts and competencies to succeed in the upcoming CAA as well as the learning resources they should study; they were urged to ask for individualized assistance. They may also have received extrinsic motivation. Learners who had not submitted more than one CAA received information about alternatives to achieving a passing grade (e.g., mandatory CAA, an examination when the semester ends), and they could also unsubscribe from the messaging system if they wished.
FM2 was sent when the CAA was graded; it explained the prediction issued and pushed learners to consult their dashboard to improve their warning level in the next CAA. FM2 varied depending on the learner’s warning level, allowing for high personalization. Learners at low risk received a congratulation message. Learners could be classified as at medium risk for three reasons, and the message differed in each case. First, the learner passed the CAA but with a grade lower than the minimum grade suggested by the EWS. Second, the EWS model inaccurately predicted that she was not at risk, in which case the EWS indicated the model’s lack of accuracy and warned her about potential future problems. Third, the EWS inaccurately predicted that the learner was at risk. Learners at high risk received different messages, depending on whether or not they submitted the CAA (i.e., the system distinguished between one or several consecutive non-submitted CAAs). Learners who submitted but failed and were at risk, and for whom the prediction is accurate, received a message that positively valued their effort and offered personalized assistance.
The intervention mechanism was able to adapt. Teachers were able to choose which messages to send depending on course characteristics. Some messages could be combined. For example, I1 could be integrated into FM1 when CAAs were related. Similarly, FM1 could be integrated into FM2 when the CAA solution and grades were published at close to the same time. However, it was mandatory to provide FM2, as it dealt with the issued predictions, which were probability estimations. To avoid discouragement or overconfidence, which could have negatively impacted their performance, learners must have understood the uncertainty level.
We proposed that higher personalization at the appropriate time in a course positively impacted learners’ performance and satisfaction. Using a nudging intervention mechanism combined with an EWS supported both these requirements. Therefore, we identified three research questions:
LIS system development followed a mixed research methodology (see Figure 2) that combined an action research methodology with a design and creation approach (Oates, 2006).
Figure 2
Research Method
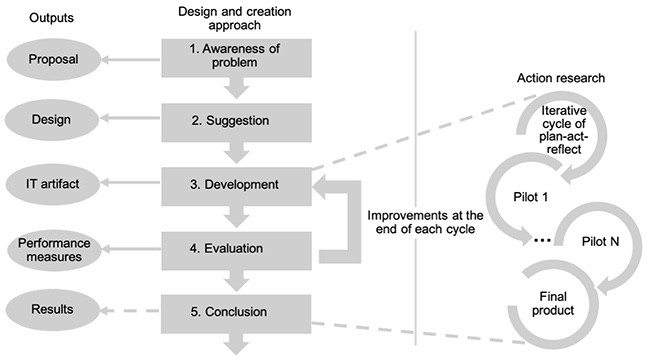
Once a problem was detected and shared (i.e., learners’ at-risk identification and support was required), an artifact solution (i.e., the LIS system) was suggested. Next, the artifact was gradually implemented and tested in real scenarios following an iterative cycle of plan-act-reflect. After each cycle, an evaluation was done according to performance measures. Depending on the results, changes in the artifact were introduced, causing a new cycle until the final artifact was obtained. The research we present constituted a cycle (see Figure 3) conducted in the second semester of the 2019-2020 academic year, where the nudging intervention mechanism was tested.
The study participants were learners from the computer science bachelor’s degree. Participants were enrolled in the first-year Computer Fundamentals course where they learned to analyze and synthesize digital circuits and developed an understanding of the underlying computer architecture. Learning resources for the course were text-based and multimedia materials. The continuous assessment model comprised three assessment activities (CAA1, CAA2, and CAA3) as well as the final project (FP). A face-to-face exam at the end of the semester complemented the continuous assessment. Although the activities were assessed using a qualitative scale, grades (Gr) were transformed at the end of the semester to numerical values (A: 9/10, B: 7/8, C+: 5/6, C-: 3/4, and D: 0/1/2). The final mark (FM) was computed as follows:
FM = MAX (10%GrCAA1 + 10%GrCAA2 + 10%GrCAA3 + 35%GrFP + 35%GrEXAM, 50%GrFP + 50%GrEXAM)
As we can observe in the previous formula, it was possible for learners to pass the course without performing CAA1, CAA2, and CAA3, but the final project (FP) and the exam were mandatory. Teachers conditioned learners must have reached a minimum grade of 4 on both the FP and the exam to pass; the grading system went from 0 to 10, with 5 as the lowest passing grade.
Computer Fundamentals was a suitable course for our analysis because there was a low academic success ratio (40% to 50% from enrollment), mainly due to students who dropped out. Although it was possible to pass the course without performing some CAA, teachers knew that learners who did not perform them had difficulties. Previous research (Rodríguez et al., 2019) concluded that dropout rates in the course were related to failing or not submitting the CAA. Several factors have affected that. First, learners were required to manage their academic work plus professional and family commitments. As well, learners reported that their course workload sometimes meant they were faced with similar deadlines for multiple CAA. Finally, learners encountered difficulties in the course content, CAA perceived difficulty and length, and the appropriateness of learning resources. These factors were even more relevant because it was a first-year course, and many learners were new to online education.
Figure 3
Research Procedure

The risk level classification depended on the accuracy of the predictive model available through the EWS, which included as many submodels as CAAs in the course. Table 2 shows the accuracy of the submodels for Computer Fundamentals. The metrics were: (a) the number of at-risk learners correctly identified (TP); (b) the number of non-at-risk learners correctly identified (TN); (c) the number of at-risk learners not correctly identified (FP); (d) the number of non-at-risk learners not correctly identified (FN); (e) the global accuracy of the model (ACC); (f) the accuracy when detecting at-risk learners (TPR true positive rate); (g) the accuracy when distinguishing non-at-risk learners (TNR, true negative rate); (h) the F-score (F1.5) made up of a harmonic mean of the true positive value (precision) and the TPR (recall) that weighted correct at-risk identification; (i) and the selected classification algorithm (classifier). The accuracy of detecting non-at-risk learners (TNR) started at 77.72% and reached a value of 94.69% in the last activity. Detecting at-risk learners (TPR) started at 71.78%, but it reached a similar value to the TNR in the last activity, namely 93.77%. In most cases, learners received the right nudges regarding their actual failing risk with this level of accuracy.
Table 2
Performance of the Predictive Model to Identify Potential Course Failure
| Submodel | TP | FP | TN | FN | ACC (%) | TNR (%) | TPR (%) | F1.5 (%) | Classifier |
| PrCAA1 | 96 | 46 | 117 | 28 | 74.22 | 77.72 | 71.78 | 74.30 | DT |
| PrCAA2 | 192 | 74 | 279 | 15 | 84.11 | 92.75 | 79.04 | 83.32 | DT |
| PrCAA3 | 184 | 29 | 324 | 23 | 90.71 | 88.89 | 91.78 | 92.27 | SVM |
| PrFP | 196 | 22 | 331 | 11 | 94.11 | 94.69 | 93.77 | 94.68 | KNN |
We initially designed two learners’ groups to analyze the research questions, each receiving different nudge sets (see Figure 3). The UOC committee for research ethics required that learners consent to participate in any study following the European General Data Protection Regulation (https://gdpr-info.eu/). Once consent was received, the LIS system processed the learners’ anonymized data. Due to this, a third learner group was included: the learners who declined to participate. Each of the three learner groups received the following nudges (see Table 1):
Of the 389 enrolled learners in Computer Fundamentals, 170 (43.70%) learners signed the consent and were placed in the first group, 82 (21.07%) signed the consent and were placed in the second group, and 137 (35.21%) learners who did not sign the consent were assigned to the third group.
Three instruments were used for collecting data. First, quantitative data about learners’ performance and dropout rates were obtained from the institutional information systems. Second, data concerning learners’ risk came from the EWS. All data were stored in comma-separated values format. R language was used to merge and analyze the datasets. For the first research question, statistical significance analysis of performance was done using the unpaired two-sample Wilcoxon test due to the non-normal distribution of the final mark (Kruskal, 1957). Descriptive analysis showed the difference in median, mean, standard deviation, minimum, and maximum values. For the second research question, the dropout rate difference for each learners’ group was analyzed. Finally, for qualitative data, a questionnaire embedded into the EWS was used. Thus, the third research question was supported by analyzing Likert scale average values in this opinion survey.
First, we analyzed each group’s performance, and then, the groups’ statistical significance. Performance data were based on the learners’ final marks. The groups were filtered by removing learners who did not submit any CAA. Such learners dropped out of the course before submitting CAA1. Many of them did not start the course, so including them would have skewed the findings and conclusions.
Table 3 summarizes the participants’ demographic information. There were 157 participants after the filtering process. Removing learners who dropped out from the beginning (those who did not start the CAA) mainly impacted the not signed group (i.e., 27.01%). Their impact on other groups was significantly less (i.e., 7.65% on all nudges group and 7.32% on FM2 only group). Concerning gender distribution, there was a gender imbalance, consistent with women’s minority presence in science, technology, engineering, and mathematics (Barr, 2014). Finally, participants’ ages ranged from 21 to 45 years in all groups, and it did not influence the participation in the study.
Table 3
Demographic Information
| Participant category | All nudges | FM2 only | Not signed | |||
| n | Participant rate | n | Participant rate | n | Participant rate | |
| Group | ||||||
| Filtered | 157 | 92.35% | 76 | 92.68% | 100 | 72.99% |
| CAA not started | 13 | 7.65% | 6 | 7.32% | 37 | 27.01% |
| Total by group | 170 | 82 | 137 | |||
| Gender | ||||||
| Male | 133 | 84.71% | 68 | 89.47% | 94 | 94.00% |
| Female | 24 | 15.29% | 8 | 10.53% | 6 | 6.00% |
| Total by group | 157 | 76 | 100 | |||
| Age range in years | ||||||
| (18-20) | 6 | 3.82% | 1 | 1.32% | 1 | 1.00% |
| (21-25) | 38 | 24.20% | 23 | 30.26% | 35 | 35.00% |
| (26-30) | 33 | 21.02% | 14 | 18.42% | 22 | 22.00% |
| (31-35) | 26 | 16.56% | 12 | 15.79% | 11 | 11.00% |
| (36-40) | 24 | 15.29% | 12 | 15.79% | 12 | 12.00% |
| (41-45) | 18 | 11.46% | 7 | 9.21% | 7 | 7.00% |
| (46-50) | 9 | 5.73% | 6 | 7.89% | 7 | 7.00% |
| (51-55) | 3 | 1.91% | 1 | 1.32% | 5 | 5.00% |
| >55 | 0 | 0.00% | 0 | 0.00% | 0 | 0.00% |
| Total by group | 157 | 76 | 100 | |||
Table 4 summarizes the descriptive statistics for the groups by age distribution. The number of participants after the filtering process (filtered), as well as the median, mean, standard deviation (SD), minimum (min.), and maximum (max.) values of the final marks are shown. Each group was represented in all mark categories, but the median and mean were significantly higher when learners received nudges. Receiving all nudge types had even more impact on the final mark median. The grade distribution did not follow a normal distribution. There was a high dispersion from the minimum value (zero) to the maximum value (10), as indicated by the SD variability. However, comparing the median and the mean indicated that a large number of learners passed the course (grade equal to or higher than five) with higher grades when they received all nudge types. When receiving FM2 only, metrics values were similar. Finally, learners who did not receive nudges tended to fail the course irremediably. Regarding age distribution, we observe the same tendency. Learners in all age ranges who received more nudges improved their performance to a considerable extent.
Table 4
Final Mark Distribution: Descriptive Statistics for Each Group
| Age range in years | Filtered | Median | Mean | SD | Min. | Max. |
| All nudges | ||||||
| (18-20) | 6 | 8.50 | 6.48 | 3.57 | 0.00 | 9.90 |
| (21-25) | 38 | 7.50 | 5.74 | 3.83 | 0.00 | 10.00 |
| (26-30) | 33 | 7.20 | 6.47 | 3.64 | 0.00 | 10.00 |
| (31-35) | 26 | 8.00 | 6.59 | 3.60 | 0.00 | 10.00 |
| (36-40) | 24 | 7.80 | 5.75 | 4.31 | 0.00 | 10.00 |
| (41-45) | 18 | 7.25 | 6.01 | 3.85 | 0.00 | 10.00 |
| (46-50) | 9 | 7.30 | 6.84 | 2.87 | 0.00 | 9.90 |
| (51-55) | 3 | 7.00 | 5.67 | 5.13 | 0.00 | 10.00 |
| >55 | 0 | -- | -- | -- | -- | -- |
| Total by group | 157 | 7.60 | 6.16 | 3.73 | 0.00 | 10.00 |
| FM2 only | ||||||
| (18-20) | 1 | 2.00 | 2.00 | -- | 2.00 | 2.00 |
| (21-25) | 23 | 5.90 | 5.16 | 3.70 | 0.00 | 10.00 |
| (26-30) | 14 | 5.10 | 4.76 | 3.49 | 0.00 | 10.00 |
| (31-35) | 12 | 7.20 | 5.74 | 4.17 | 0.00 | 10.00 |
| (36-40) | 12 | 6.10 | 5.45 | 3.84 | 0.00 | 10.00 |
| (41-45) | 7 | 5.60 | 4.50 | 4.40 | 0.00 | 10.00 |
| (46-50) | 6 | 8.45 | 7.35 | 3.69 | 0.00 | 9.90 |
| (51-55) | 1 | 7.30 | 7.30 | -- | 7.30 | 7.30 |
| >55 | 0 | -- | -- | -- | -- | -- |
| Total by group | 76 | 5.80 | 5.26 | 3.72 | 0.00 | 10.00 |
| Not signed | ||||||
| (18-20) | 1 | 0.00 | 0.00 | -- | 0.00 | 0.00 |
| (21-25) | 35 | 0.00 | 2.82 | 3.30 | 0.00 | 9.10 |
| (26-30) | 22 | 0.00 | 2.15 | 3.44 | 0.00 | 9.30 |
| (31-35) | 11 | 7.30 | 5.36 | 4.35 | 0.00 | 9.80 |
| (36-40) | 12 | 7.65 | 4.95 | 4.42 | 0.00 | 9.90 |
| (41-45) | 7 | 2.00 | 4.03 | 4.47 | 0.00 | 9.30 |
| (46-50) | 7 | 2.45 | 3.95 | 4.27 | 0.00 | 9.60 |
| (51-55) | 5 | 0.00 | 1.87 | 3.75 | 0.00 | 7.5 |
| >55 | 0 | -- | -- | -- | -- | -- |
| Total by group | 100 | 0 | 3.32 | 3.83 | 0.00 | 9.90 |
The unpaired two-sample Wilcoxon test was used to check the statistical significance of the distribution of the improvement in final marks. The null hypothesis was that the scores were worse or equal when more nudges were received. Table 5 shows the comparison among all groups.
Table 5
Results of the Unpaired Two-Sample Wilcoxon Test on Final Mark Distribution
| Group | Group comparison | p-value | Significancea | Hypothesis |
| All nudges | FM2 only | 0.021 | * | Reject |
| All nudges | Not signed | 2.3e-08 | **** | Reject |
| FM2 only | Not signed | 0.00028 | *** | Reject |
Note. a Significance: * p ≤ 0.05, ** p ≤ 0.01, *** p ≤ 0.001, **** p ≤ 0.0001.
Although the hypothesis was rejected in all cases, there were different significance levels. The comparison with the learners who did not sign was clearly significant (i.e., p-value 2.3e-08 compared to the all nudges group and 0.00028 compared to the FM2 only group). Thus, obtaining some additional nudges during the CAA positively impacted learners’ performance. When comparing different nudge types (i.e., all nudges vs. FM2 only), the significance level was lower with a p-value of 0.021. However, there was still some significance when receiving all nudge types. The results were consistent with the descriptive statistics of Table 4. Receiving FM2 gave learners information about the assessed CAA and their risk level only. However, receiving additional nudges enlightened learners with information about competencies to acquire in the next CAA, skills needed from the previous CAA, and reminders about the next submission. Figure 4 summarizes the results with a notched box-and-whisker plot.
We analyzed how the dropout rate was affected depending on the nudge types provided. We excluded learners who did not submit any CAAs and the FP. Consequently, Table 6 does not summarize dropout for CAA1 because such learners were excluded from the analysis. As a result, Table 6 reports the dropout rate for each CAA and the FP showing the number of participants (filtered), dropped out learners (n), and percentages of learners within the group (%).
Figure 4
Box-And-Whisker Plot of the Final Mark Distribution With Corresponding p-Value of the Unpaired Two-Sample Wilcoxon Test
Table 6
Dropout Rate for Each Group and Assessment Activity
| Group | Filtered | CAA2 | CAA3 | FP | |||
| n | % | n | % | n | % | ||
| All nudges | 157 | 14 | 8.92 | 26 | 16.56 | 45 | 28.66 |
| FM2 only | 76 | 6 | 7.89 | 13 | 17.11 | 25 | 32.89 |
| Not signed | 100 | 26 | 26.00 | 38 | 38.00 | 57 | 57.00 |
The dropout rate was higher for learners who did not sign the consent. By the end of the semester, more than half of them had dropped out. Computer Fundamentals is a first-year course; many learners were new to university studies and to online learning. These factors greatly influenced the dropout rate, which was 35.21% on average. However, at the end of the semester, the dropout rate for learners who received nudges (FM2 only or the complete set) was lower than the average.
Once each CAA was graded, the risk level assigned, and the prediction for the upcoming CAA made available, learners were prompted to answer a short opinion questionnaire. Answers were based on a Likert scale from 1 (strongly negative) to 5 (strongly positive). There were three questions: (a) Do you think the received messages are useful? (b) Are you going to continue the course? and (c) What is your mood after receiving the messages? Since the survey was embedded in the EWS, we were able to associate the learners’ responses with their group. Table 7 summarizes the results and shows the Likert scale average values on the three questions for each CAA and the FP.
Table 7
Learners’ Opinion About the Nudges: Usefulness, Engagement, and Their Mood
| Group | Usefulness | Engagement | Mood | Responses |
| CAA1 | ||||
| All nudges | 4.00 | 4.04 | 3.88 | 74 |
| FM2 only | 3.82 | 4.00 | 3.73 | 38 |
| CAA2 | ||||
| All nudges | 3.85 | 3.89 | 3.83 | 91 |
| FM2 only | 3.74 | 3.84 | 3.82 | 50 |
| CAA3 | ||||
| All nudges | 4.03 | 4.05 | 3.86 | 87 |
| FM2 only | 4.03 | 4.00 | 3.90 | 39 |
| FP | ||||
| All nudges | 3.90 | 4.04 | 3.89 | 85 |
| FM2 only | 3.68 | 3.88 | 3.71 | 41 |
Note. Sample sizes: all nudges (n = 157), FM2 only (n = 76).
All learners considered that the nudges were helpful for their learning process, with an appraisal higher than 65% on average and reaching values near 75%. Learners who received all nudge types provided a higher appraisal. A similar effect was observed in engagement with a value higher than 70%. Learners who received more nudges expected to continue the course with a slightly higher value. Finally, learners considered they had a positive mood during the course with a value higher than 65% on average and higher appraisals when more nudges were received.
Concerning the first research question, learners performance improved when more nudge types were received. The statistical significance between learners who did not sign the consent and received no nudges, and those who did, was high (i.e., p ≤ 0.001). Learners who did not sign the consent received only a final grade, the CAA solutions in the virtual classroom, and general feedback through the teacher’s blackboard, without any personalization. Each learner needed to reflect on her mistakes from the CAA solution all on her own and perform this reflection on time. It was difficult for her to know her likelihood of passing. A learner who agreed to be in the study also needed to carry out this reflection, but nudges helped her to do this and set the appropriate time in which to carry out the reflection. The groups who received all nudges or FM2 only received messages with a high degree of personalization. FM2 in particular had a large impact on a learner’s performance because it helped her know her place in the course and where to go next. As a feedforward message, it provided learner assistance on how to address the CAAs thereafter. It also gave a backward view of her achievement in past CAAs and a forward view of her likelihood of passing. Despite the discussion about what is considered feedforward (Reimann et al., 2019; Sadler, 2010), its value for “focusing attention on the potential for uptake of information and the necessity of action” is clear (Reimann et al., 2019, p. 10).
When comparing groups of learners who signed the consent, performance was still significant in the group who received all nudges. Results were consistent with the literature. Reminders and informational nudges (Martinez, 2014) enhanced performance and completion rates. Furthermore, when learners received more nudges, they improved their performance significantly in all age ranges with a remarkable result: performance was better by learners aged 31 to 40 years. Research in online settings (Cheung & Kan, 2002; Didia & Hasnat, 1998) has also observed that maturity, combined with previous online learning experience, improved self-regulation and impacted performance.
In terms of research question two, there was a significant reduction in dropout rates in the groups that received all nudges and those who received FM2 only. These learners felt better supported and guided as a result of the teacher’s recommendations. Learners who did not sign the consent may have felt alone. Only proactive learners used the different communication channels (i.e., the virtual classroom forums or the teacher’s e-mail). The big difference was in terms of who started the possible dialogue (Ajjawi & Boud, 2018). For those who did not sign the consent, it was always the learner who initiated dialogue. For students who received nudges, these messages opened the opportunity to reply to the teacher and create a teacher-learner relationship. Our results were consistent with the literature; meaningful teacher-learner relationships created supportive learning environments (Sparks et al., 2015), and promoted self-efficacy and motivation. We cannot underestimate the efficacy of learners receiving messages in their e-mail. Such messages signalled that some action was expected of the learner at a specific time. Learners who did not consent to participate did not receive this signal. They needed to be proactive and access the virtual classroom frequently to be aware of what was going on. Otherwise, they ran the risk of reacting too late, which partially explains why online learners have tended to concentrate their efforts in courses where they have better performance (Grau-Valldosera et al., 2019). Finally, the results showed a significant decrease in the dropout rate among the groups that received all the nudges and the group that received FM2 only. In the literature, some have argued that reminders significantly impact task completion and engagement (Kraft & Rogers, 2015; York et al., 2019), and informational nudges about competencies to address current activity are necessary (Martinez, 2014) in order to encourage learners to revisit previous learning resources and activities.
Regarding the third research question, our results showed that learners were satisfied with the nudges they received. As Eom et al. (2006) claimed, the teacher’s personalized messages impacted satisfaction. Martínez-Argüelles et al. (2015) found a relationship between motivation and mood with receipt of personalized information from the teacher. A similar effect was observed in engagement: learners who received more nudges were more likely to expect to continue the course. Finally, learners’ mood was appraised more positively when more nudges were received. Higher values were obtained on usefulness and engagement, while slightly lower values were obtained regarding learners’ mood but still were above the average. Thus, the learners’ opinions about usefulness, engagement, and mood were positive.
Finally, we note some research limitations. Learners decided to participate in the pilot, inducing an auto-selection bias due to the institutional ethical requirements. These were usually the most engaged learners, and their performance is typically better. There is also a gender bias inherent to the course. Auto-selection mainly affected the first and second research questions, while mortality bias (i.e., learners who discontinued using the system and did not answer the opinion survey) affected the third research question.
Our contribution is twofold. First, we present a nudging intervention mechanism combined with an EWS based on AI techniques. Teachers choose which nudge types are appropriate according to educational principles and also when to send them. The nudges are personalized according to learners’ risk level and profile, and learners can be nudged with feedforward to prevent a failure outcome. As far as we know, few studies have focused on feedforward nudges; most studies have focused on automatic messages with marks (Clarizia et al., 2018) rather than on nudges to encourage learners, or just on detecting at-risk learners (Vasquez et al., 2015). Our intervention mechanism automatically manages nudges based on the EWS predictions and risk classification.
Second, we study the nudging intervention mechanism in a real online educational setting. The research questions allowed us to analyze their usefulness and effectiveness. Results suggest that nudges positively impact learners’ performance and satisfaction. Moreover, their performance and satisfaction increase when more nudge types are sent.
Our findings have a significant impact on online, distance, and open learning practice, reinforcing the role of AI in extracting relevant information from datasets in order to enhance the teaching-learning process. The benefits of our approach are diverse: timely learner support and guidance, better learning experience, personalization, and effective learner-teacher communication. Our experience shows that this approach can coexist with other available feedback mechanisms.
Nevertheless, our intervention mechanism can achieve even better personalization levels. In future studies, the EWS could make better use of learners’ data by detecting new learner classes with particular problems (e.g., dropout, self-regulation, special needs), thereby improving the efficacy of nudges. For example, repeater and novice learners have different needs compared to high-performance learners. A deeper qualitative analysis, including interviews and focus groups, should be performed to better understand learners’ appraisal of nudges’ effectiveness. Finally, a longitudinal study to analyze learner cohorts is required to see if the results persist across semesters.
This research was funded by the eLearn Center at Universitat Oberta de Catalunya through the project New Goals 2018NG001 LIS: Learning Intelligent System.
Ajjawi, R., & Boud, D. (2018). Examining the nature and effects of feedback dialogue. Assessment and Evaluation in Higher Education, 43(7), 1106-1119. https://doi.org/10.1080/02602938.2018.1434128
Arnold, K. E., & Pistilli, M. D. (2012, April 29). Course signals at Purdue: Using learning analytics to increase student success. In S. Dawson, C. Haythornthwaite, S. B. Shum, D. Gasevic & R. Ferguson (Eds.), Proceedings of the 2nd International Conference on Learning Analytics and Knowledge (pp. 267-270). Association for Computing Machinery. https://doi.org/10.1145/2330601.2330666
Baneres, D., Rodríguez, M. E., Guerrero-Roldán, A. E., & Karadeniz, A. (2020). An early warning system to detect at-risk students in online higher education. Applied Sciences (Switzerland), 10(13), 4427. https://doi.org/10.3390/app10134427
Barr, V. (2014, December 1). Women in STEM, women in computer science: We’re looking at it incorrectly. Blog@CACM. https://cacm.acm.org/blogs/blog-cacm/180850-women-in-stem-women-in-computer-science-were-looking-at-it-incorrectly/
Benartzi, S., Beshears, J., Milkman, K. L., Sunstein, C. R., Thaler, R. H., Shankar, M., Tucker-Ray, W., Congdon, W. J., & Galing, S. (2017). Should governments invest more in nudging? Psychological Science, 28(8), 1041-1055. https://doi.org/10.1177/0956797617702501
Bucher, T., Collins, C., Rollo, M. E., McCaffrey, T. A., De Vlieger, N., Van der Bend, D., Truby, H., & Perez-Cueto, F. J. A. (2016). Nudging consumers towards healthier choices: A systematic review of positional influences on food choice. British Journal of Nutrition, 115(12), 2252-2263. https://doi.org/10.1017/S0007114516001653
Caraban, A., Karapanos, E., Gonçalves, D., & Campos, P. (2019, May 2). 23 ways to nudge: A review of technology-mediated nudging in human-computer interaction. Proceedings of the 2019 CHI Conference on Human Factors in Computing Systems (article 503). Association for Computing Machinery. https://doi.org/10.1145/3290605.3300733
Castro, R. (2019). Blended learning in higher education: Trends and capabilities. Education and Information Technologies, 24(4), 2523-2546. https://doi.org/10.1007/s10639-019-09886-3
Chassignol, M., Khoroshavin, A., Klimova, A., & Bilyatdinova, A. (2018). Artificial intelligence trends in education: A narrative overview. Procedia Computer Science, 136, 16-24. https://doi.org/10.1016/j.procs.2018.08.233
Chen, L., Chen, P., & Lin, Z. (2020). Artificial intelligence in education: A review. IEEE Access, 8, 75264-75278. https://doi.org/10.1109/ACCESS.2020.2988510
Cheung, L. L. W., & Kan, A. C. N. (2002). Evaluation of factors related to student performance in a distance-learning business communication course. Journal of Education for Business, 77(5), 257-263. https://doi.org/10.1080/08832320209599674
Clarizia, F., Colace, F., Lombardi, M., Pascale, F., & Santaniello, D. (2018, September 23). Chatbot: An education support system for student. In A. Castiglione, F. Pop, M. Ficco & F. Palmieri (Eds.), Cyberspace Safety and Security, CSS 2018 (Lecture Notes in Computer Science, Vol. 11161, pp. 291-302). Springer. https://doi.org/10.1007/978-3-030-01689-0_23
Damgaard, M. T., & Nielsen, H. S. (2018). Nudging in education. Economics of Education Review, 64, 313-342. https://doi.org/10.1016/j.econedurev.2018.03.008
Didia, D., & Hasnat, B. (1998). The determinants of performance in the university introductory finance course. Financial Practice & Education, 8(1), 102-107.
Eom, S. B., Wen, H. J., & Ashill, N. (2006). The determinants of students’ perceived learning outcomes and satisfaction in university online education: An empirical investigation. Decision Sciences Journal of Innovative Education, 4(2), 215-235. https://doi.org/10.1111/j.1540-4609.2006.00114.x
Grau-Valldosera, J., MinguillÓn, J., & Blasco-Moreno, A. (2019). Returning after taking a break in online distance higher education: from intention to effective re-enrollment. Interactive Learning Environments, 27(3), 307-323. https://doi.org/10.1080/10494820.2018.1470986
Hummel, D., & Maedche, A. (2019). How effective is nudging? A quantitative review on the effect sizes and limits of empirical nudging studies. Journal of Behavioral and Experimental Economics, 80, 47-58. https://doi.org/10.1016/j.socec.2019.03.005
Kraft, M. A., & Rogers, T. (2015). The underutilized potential of teacher-to-parent communication: Evidence from a field experiment. Economics of Education Review, 47, 49-63. https://doi.org/10.1016/j.econedurev.2015.04.001
Kruskal, W. H. (1957). Historical notes on the Wilcoxon Unpaired Two-Sample Test. Journal of the American Statistical Association, 52(279), 356-360. https://doi.org/10.1080/01621459.1957.10501395
Márquez-Vera, C., Cano, A., Romero, C., Noaman, A. Y. M., Mousa Fardoun, H., & Ventura, S. (2016). Early dropout prediction using data mining: A case study with high school students. Expert Systems, 33(1), 107-124. https://doi.org/10.1111/exsy.12135
Martínez-Argüelles, M. J., Plana, D., Hintzmann, C., Batalla-Busquets, J. M., & Badia, M. (2015). Usefulness of feedback in e-learning from the students’ perspective. Intangible Capital, 11(4), 627-645. https://doi.org/10.3926/ic.622
Martinez, I. (2014). The effects of nudges on students’ effort and performance: Lessons from a MOOC (EdPolicyWorks Working Paper Series No. 19). https://education.virginia.edu/sites/default/files/files/EdPolicyWorks_files/19_Martinez_Lessons_from_a_MOOC.pdf
Mitrovic, A., Gordon, M., Piotrkowicz, A., & Dimitrova, V. (2019, June 21). Investigating the effect of adding nudges to increase engagement in active video watching. In S. Isotani, E. Millán, A. Ogan, P. Hastings, B. McLaren & R. Luckin (Eds.), Artificial Intelligence in Education, AIED 2019 (Lecture Notes in Computer Science, Vol. 11624, pp. 320-332). Springer. https://doi.org/10.1007/978-3-030-23204-7_27
Oates, B. J. (2006). Researching information systems and computing. SAGE.
Ortigosa, A., Carro, R. M., Bravo-Agapito, J., Lizcano, D., Alcolea, J. J., & Blanco, Ó. (2019). From lab to production: Lessons learnt and real-life challenges of an early student-dropout prevention system. IEEE Transactions on Learning Technologies, 12(2), 264-277. https://doi.org/10.1109/TLT.2019.2911608
Piotrkowicz, A., Dimitrova, V., Hallam, J., & Price, R. (2020, July 14). Towards personalisation for learner motivation in healthcare: A study on using learner characteristics to personalise nudges in an e-learning context. Adjunct Publication of the 28th ACM Conference on User Modeling, Adaptation and Personalization, (pp. 287-292). https://doi.org/10.1145/3386392.3399290
Reimann, N., Sadler, I., & Sambell, K. (2019). What’s in a word? Practices associated with ‘feedforward’ in higher education. Assessment and Evaluation in Higher Education, 44(8), 1279-1290. https://doi.org/10.1080/02602938.2019.1600655
Rodríguez, M. E., Guerrero-Roldán, A. E., Baneres, D., & Karadeniz, A. (2019, November). Towards an intervention mechanism for supporting learners performance in online learning. Proceedings of the 12th Annual International Conference of Education, Research and Innovation, ICERI 2019 (pp. 5136-5145). Seville, Spain. https://doi.org/10.21125/iceri.2019.1244
Sadler, D. R. (2010). Beyond feedback: Developing student capability in complex appraisal. Assessment and Evaluation in Higher Education, 35(5), 535-550. https://doi.org/10.1080/02602930903541015
Siemens, G., & Baker, R. S. J. D. (2012, April 29). Learning analytics and educational data mining: Towards communication and collaboration. Proceedings of the 2nd International Conference on Learning Analytics and Knowledge (pp. 252-254). Association for Computing Machinery. https://doi.org/10.1145/2330601.2330661
Sparks, C., Dimmock, J., Whipp, P., Lonsdale, C., & Jackson, B. (2015). “Getting connected”: High school physical education teacher behaviors that facilitate students’ relatedness support perceptions. Sport, Exercise, and Performance Psychology, 4(3), 219-236. https://doi.org/10.1037/spy0000039
Sunstein, C. R. (2015). Which nudges do people like? A national survey. Social Science Research Network. https://doi.org/10.2139/ssrn.2619899
van Oldenbeek, M., Winkler, T. J., Buhl-Wiggers, J., & Hardt, D. (2019, May 15). Nudging in blended learning: Evaluation of email-based progress feedback in a flipped-classroom information systems course. Proceedings of the 27th European Conference on Information Systems, ECIS (article 186). AIS eLibrary. https://aisel.aisnet.org/ecis2019_rp/186
Vasquez, H., Fuentes, A. A., Kypuros, J. A., & Azarbayejani, M. (2015, December 7). Early identification of at-risk students in a lower-level engineering gatekeeper course. In 2015 IEEE Frontiers in Education Conference, FIE (vol. 2015, pp. 1-9). Institute of Electrical and Electronics Engineers. https://doi.org/10.1109/FIE.2015.7344361
Weijers, R. J., de Koning, B. B., & Paas, F. (2020). Nudging in education: From theory towards guidelines for successful implementation. European Journal of Psychology of Education, 36, 883-902. https://doi.org/10.1007/s10212-020-00495-0
York, B., Loeb, S., & Doss, C. (2019). One step at a time: The effects of an early literacy text-messaging program for parents of preschoolers. Journal of Human Resources, 54(3), 537-566. https://doi.org/10.3368/jhr.54.3.0517-8756R

An Intelligent Nudging System to Guide Online Learners by M. Elena Rodríguez, Ana Elena Guerrero-Roldán, David Baneres, and Abdulkadir Karadeniz is licensed under a Creative Commons Attribution 4.0 International License.