Volume 23, Number 2
Elif Polat1, Sinan Hopcan1, and Ömer Yahşi2
1Department of Computer Education and Instructional Technology; Hasan Ali Yucel Education Faculty, Istanbul University-Cerrahpasa, Istanbul, Turkey; 2Ministry of National Education, Ankara, Turkey
Readiness is important for the success of the e-learning process. The purpose of this study was twofold: to develop a scale to measure K-12 teachers’ e-learning readiness, and to examine their readiness to teach online. The participants were 3,295 K-12 teachers working in Izmir, Turkey. First EFA, then CFA-SEM was performed. Additionally, teachers’ e-readiness in terms of gender, years of service, school level, and daily device usage time were examined. Teachers are ready for e-learning considering their overall scores. A significant difference was found in favor of males in the “technical competence” factor and in favor of females in the “colleague, content, and pedagogical and ethical competence factors”. The readiness of younger teachers is generally higher. On a factor basis, there is only a significant difference in the factors of computer self-efficacy and student readiness according to educational level. As the use of devices increases, technology-related readiness increases. The readiness of teachers plays an important role in determining future strategies, measures, and interventions that need to be taken to advance e-learning.
Keywords: e-learning, readiness factor, teachers’ e-learning readiness, scale development, K-12 teachers
Readiness is important for the success of the e-learning process. For effective e-learning, it is essential to understand each individual’s readiness. Lopes (2007) demonstrated that technology, content, culture, human resources, and financial resources affect e-learning readiness. Hong and Gardner (2018) stated that e-readiness includes self-efficacy, self-regulation, social competence, and digital competence. Aydin and Tasci (2005) identified four areas that determine the overall readiness of an institution to adopt e-learning, namely, technology, innovation, people, and self-development. As teachers deal directly with both students and course content, they are key to adapting and applying e-learning platforms to their learning environment and are expected to use e-learning to pursue the globalization of knowledge and provide technologically enhanced classroom interaction (Obara & Abulokwe, 2012). Teachers play a critical role in the implementation of online education (Mercado, 2008) and their readiness is dependent on factors such as the design of learning content and ensuring students are successful (Eslaminejad et al., 2010).
The success of technology in teaching and learning does not only depend on the availability and usability of technical tools such as a strong network infrastructure and fast, modern computers and applications. Where teachers are not trained to adopt and use e-learning and the technologies that facilitate it, implementation will generally be unsuccessful (Ziphorah, 2014). To ensure to the extent possible the successful introduction of an e-learning program, some form of assessment of teachers’ preparation is needed as any reluctance may impact implementation (Summak et al., 2010).
Some of the variables affecting structure and interaction are gender, strategy and approaches, skills, and readiness of technology. Teachers have an important role as they take on tasks such as preparing online content and motivating students. For this reason, teachers must be well prepared if e-learning is to be a success. The e-learning environment is very different from traditional learning environments, and it is essential to ensure that teachers are able to adapt (Phan & Dang, 2017).
Teachers not only need the technical competence and ability to develop content but also knowledge of online teaching methods (Phan & Dang, 2017). The e-learning environment is not about providing a set of documents. It involves basic features such as enabling interaction with and among students, designing content, and using appropriate teaching methods (Eslaminejad et al., 2010).
Most of the existing models of e-learning readiness were designed and tested in commercial organizations and higher education institutions (Koloseni & Mandari, 2017) rather than primary and secondary schools (Summak et al., 2010). Any measurement tool developed for e-learning readiness needs to be carefully considered before applying it to a particular context. Demir and Yurdugül (2015) suggested that the selection of a developed model and measurement tools should be done according to the needs of each context and target audience, and that any deficiencies identified should be eliminated (Demir & Yurdugül, 2015).
There are a number of studies that measure the e-learning readiness of teachers (Al-Furaydi, 2013; Amalia et al., 2021; Çınar et al., 2021; Howard et al., 2021; Hu et al., 2020; Ouma et al., 2013; Pusparini et al., 2018; Setati & Paledi, 2019; So & Swatman, 2006; Trayek et al., 2016; Yun & Murad, 2006). Çınar et al. (2021), for example, investigated the readiness of in-service Turkish teachers. Their study, with 555 teachers from pre-school to high school, revealed that teachers had a medium-level of e-learning readiness. Another study with 222 secondary education teachers from different countries that aimed to determine their readiness revealed the importance of institutional support (Howard et al., 2021).
Al-Furaydi (2013) provided a descriptive analysis in his study with 71 English teachers and found they were ready to adopt e-learning and had a high level of computer literacy. In a similar study, Hu et al. (2020) examined the reliability of an e-learning readiness survey in secondary schools in Kenya. The authors conducted the study using the descriptive survey design model with 72 teachers, principals, and students. They revealed that teachers were ready to embrace e-learning technology, but their technical capacity required improvement through training for successful e-learning adoption (Ouma et al., 2013). A study by Amalia et al. (2021), conducted with 15 teachers using qualitative methods, found that teachers were ready for e-learning. According to So and Swatman (2006), teachers in Hong Kong were not fully ready to use e-learning technologies for teaching and learning. They conducted their research with 131 teachers from primary and secondary schools. Setati and Paledi (2019) assessed the e-learning readiness of 120 primary and secondary school teachers in Africa. Trayek et al. (2016) revealed the e-learning readiness of 475 secondary school teachers in Palestine. Similarly, Yun and Murad (2006) measured 412 secondary school teachers’ e-learning readiness. Pusparini et al. (2018) conducted a study with a small sample of 20 people using the explanatory sequential design model to investigate the e-learning readiness of high school English teachers.
Currently the available literature has focused specifically on either only one or two primary/secondary/high school levels or on specific disciplines such as English teaching. As far as we are aware, there are no studies directly addressing K-12 teachers. In addition, the studies generally use the descriptive method, the sample sizes are not particularly large, and few studies aim to develop a scale. Despite K-12 teachers’ e-readiness being crucial to the success of e-learning, there is room for much more work to be done in this area. It is vital for teachers to be prepared for online teaching. Where e-learning readiness levels are insufficient, the chance of success in e-learning is low (Moftakhari, 2013). Understanding these factors and planning for them can increase the success of K-12 institutions in applying e-learning. There appears to be a gap in the literature for both developing a valid scale to measure K-12 teachers’ e-learning readiness and conducting research with robust methods using this tool with large samples. To this end, the study aimed to develop a scale to measure K-12 teachers’ e-learning readiness, and to examine their readiness to teach online.
This study posits factors that can influence e-learning readiness using the HOT-fit model. Human organization and technology-fit (HOT-fit) is a framework developed by Yusof et al. (2008) based on a combination of DeLone and McLean’s information system (IS) success model and IT organization fit model. Human factors consist of computer self-efficacy and subjective norms (Çiğdem & Topcu, 2015; Oketch et al., 2014; Zheng et al., 2018) and organizational factors comprise IS/IT knowledge and management support (Oketch et al., 2014). Technological factors are relative advantage, compatibility, and complexity (Oketch et al., 2014; Zheng et al., 2018).
A 70-question scale consisting of 13 factors was developed by the researchers. The developed scale was distributed to 3,525 people. Separate datasets were used for exploratory factor analysis (EFA) (n = 1,081), confirmatory factor analysis (CFA) (n = 1,086), and implementation (n = 1,128).
The item development process began after consulting the literature and studies that had examined e-learning readiness. Theoretical frameworks, models, and previous scales were carefully scrutinized (Martin, Wang, et al., 2019; So & Swatman, 2006; Texas A&M University, 2021; University of Toledo, 2021). Following the literature review on indicators of online teaching readiness, the first phase of the study generated 75 items measuring 13 constructs: (a) technical competence, (b) attitude, (c) communication skills, (d) course design/pedagogical competence, (e) time management, (f) computer self-efficacy, (g) infrastructure, (h) management support, (i) colleagues, (j) student readiness, (k) content, (l) complexity of technology, and (m) relative usefulness. These items were measured using a five-point Likert scale (-2 = strongly disagree, -1 = disagree, 0 = neutral, 1 = agree, 2 = strongly agree). The study used the HOT-fit model to structure the categories and factors. This model has the potential to evaluate the appropriateness of online teaching readiness (Mirabolghasemi et al., 2019).
As a key step to ensure potential respondents would be able to understand the items, one-on-one interviews were conducted with five teachers with knowledge and experience of online education. Necessary revisions were made.
In order to provide face validity, content validity, and clarity of scale items, one-on-one interviews were conducted with four researchers in the field of teacher education. Based on suggestions and recommendations of the experts, items found to have a double-meaning, or to be ambiguous, complex, or redundant were revised or removed. At this stage, the number of scale items decreased from 75 to 70.
A total of three unique sets of samples were reached in the study. Two sample sets of participants were employed for K-12 teachers online teaching readiness scale development. The first sample included 1,081 K-12 teachers working in Izmir, Turkey. The second sample consisted of 1,086 K-12 teachers working in Izmir, Turkey. The literature suggests at least 300 participants are sufficient for EFA (Field, 2009; Tabachnick & Fidell, 2007). The demographic characteristics of these participants is presented in Table 1. In addition, a third set of participants was used in the relational study. This consisted of 1,128 K-12 teachers working in Izmir, Turkey. The demographic information regarding these participants is also presented in Table 1.
A questionnaire was sent to the K-12 teachers in the six districts of Izmir. Teachers were informed about voluntary participation, given a brief explanation of the purpose of the study, and told that they could withdraw from the study at any time. It took approximately 10-15 minutes for participants to complete the scale.
Table 1
Demographic Characteristics of Participants
| Characteristics | Sample 1 | Sample 2 | Sample 3 | Full Sample | ||||
| n | % | n | % | n | % | n | % | |
| Gender | ||||||||
| Female | 807 | 74,7 | 801 | 73,8 | 820 | 72,7 | 2428 | 73,7 |
| Male | 274 | 25,3 | 285 | 26,2 | 308 | 27,3 | 867 | 26,3 |
| Years of service | ||||||||
| 1-5 | 80 | 7,4 | 73 | 6,7 | 65 | 5,8 | 218 | 6,6 |
| 6-10 | 128 | 11,8 | 163 | 15,0 | 147 | 13 | 438 | 13,3 |
| 11-15 | 188 | 17,4 | 202 | 18,6 | 219 | 19,4 | 609 | 18,5 |
| 16-20 | 186 | 17,2 | 201 | 18,5 | 193 | 17,1 | 580 | 17,6 |
| 21 and above | 499 | 46,2 | 447 | 41,2 | 504 | 44,7 | 1450 | 44,0 |
| Level of service | ||||||||
| Pre-school | 67 | 6,2 | 67 | 6,2 | 78 | 6,9 | 212 | 6,4 |
| Primary school | 351 | 32,5 | 347 | 32,0 | 387 | 34,3 | 1085 | 32,9 |
| Secondary School | 371 | 34,3 | 403 | 37,1 | 394 | 34,9 | 1168 | 35,4 |
| High school | 292 | 27,0 | 269 | 24,8 | 269 | 23,8 | 830 | 25,2 |
| Being Technology Literatea | 913 | 84,5 | 926 | 85,3 | 962 | 85,3 | 2801 | 85,0 |
| Daily Technological Devices Usage time | ||||||||
| Under 1 hr | 19 | 1,8 | 21 | 1,9 | 27 | 2,4 | 67 | 2,0 |
| 1-3 hr | 150 | 13,9 | 182 | 16,8 | 188 | 16,7 | 520 | 15,8 |
| 3-5 hr | 336 | 31,1 | 320 | 29,5 | 337 | 29,9 | 993 | 30,1 |
| More than 5 hr | 576 | 53,3 | 563 | 51,8 | 576 | 51,1 | 1715 | 52,0 |
Note. N = 3295 (n = 1081 for Sample 1; n = 1086 for Sample 2; n = 1128 for Sample 3); Sample 1 = for EFA analysis; Sample 2 = for CFA analysis; Sample 3 = for Implementation analysis; a Reflects the number and percentage of participants answering “yes” to this question.
In order to test the psychometric properties of the K-12 teachers’ online teaching readiness scale, first EFA then CFA-SEM was performed. Next, analyses were conducted to evaluate the validity and reliability of the scale. With the help of the first sample, EFA was conducted. With the help of sample two, confirmatory factor analysis was performed to verify the factors occurring in the EFA. SPSS 18.0 was used to perform the EFA and reliability analysis, and AMOS 21.0 was used for the CFA and SEM.
EFA and CFA assumptions were provided. Principle components of extraction method in EFA analysis and Direct Oblimin for rotation method were used. After the first EFA, item 24 was removed from the scale as it did not fall under any factor and the EFA was repeated. Item 44 was then removed from the scale as it did not fall under any factor and the EFA was repeated again. Several cross-loading problems were observed. Item 25 was removed from the scale as it was included in two factors with close values (.324 and -.352) and the EFA was repeated. Item 67 was then removed from the scale as this question was included in two factors with close values (.41 and -.341), and the EFA was repeated. Next, item 23 was removed from the scale as it was included in two factors with close values (-.373 and -.327) and the EFA was repeated. Item 43 was removed from the scale as the question did not fall under any factor and the EFA was again repeated. The load of item 26 was low (.33). Expert opinion for item 26 was that the item was not suitable for the relevant factor so it was removed from the scale and the EFA was repeated. At the end of this first round, 12 factors including 63 items were formed, and the CFA was made.
After the first CFA, item 19 was removed from the scale because its load (.38) was below .50 and the EFA was repeated. Item 21 was then removed from the scale as it was included in two factors with close values (.403 and -.303), and the EFA was repeated. Item 2 was removed because it passed to another factor with a low value (-.331), and it was not deemed appropriate by the researchers for it to be in that factor. EFA and CFA were then repeated. Covariance was created between the error terms of the items suitable to improve the CFA values. The covariances generated were as follows: 1-3, 13-14, 55-56, 48-49, 33-34, 36-37, 5-6, 29-30, 27-29, and 32-34. Then, reliability analyses were performed. AVE, CR, and CA values were checked for reliability. In light of Table 2, item 35 was removed from the scale, and the CFA was repeated.
Table 2
AVE Reliability for Factor 10
| Item no. | AVE | AVE if item removed |
| 66 | .37 | .27 |
| 19 | .38 | |
| 35 | .45a |
Note. AVE = average variance extracted; a It’s considerably high value.
Item 19 was removed from the scale because its estimate value (.46) was below .50, and the EFA was repeated. Item 66 passed to factor 9, and factor 10 was removed. Then, CFA was performed again. In light of Table 3, item 36 was removed from the scale, and the CFA was repeated. After all these processes, 10 factors and 55 items were included in the scale.
Table 3
AVE Reliability for Factor 12
| Item no. | AVE | AVE if item removed |
| 30 | .40 | .42 |
| 31 | .40 | |
| 32 | .40 | |
| 33 | .41 | |
| 34 | .40 | |
| 27 | .41 | |
| 28 | .38 | |
| 29 | .40 | |
| 36 | .43a | |
| 37 | .40 |
Note. AVE = average variance extracted; a It’s considerably high value.
In our EFA, in deciding on the number of factors, analytical techniques such as parallel analysis, scree plot, and contributions to variance were used (Field, 2009; Pallant, 2007). Since the EFA eigenvalue of the 10th factor (1.02) was lower than the parallel analysis eigenvalue (1.24), the factor number was reduced to nine and the EFA was repeated. Item 33 was removed because it passed under another factor with a low value (.368) and it was not deemed appropriate by the researchers. Then, CFA was repeated. Item 66 was removed from the scale because its load (.43) was below 0.50, and the EFA was repeated. As a result of the EFA, no change was required and CFA was made. Item 70 was removed from the scale because its load (.44) was below 0.50, and the EFA was repeated. As a result of the EFA, no change was required and CFA was made. No change was deemed necessary in the CFA results, and reliability analyses were performed.
EFA was carried out to determine the factor structure. The number of people required for EFA according to the literature is at least 300, and the first version of the scale was applied to 1,081 people in our study (Field, 2009). The Kaiser-Meyer-Olkin (KMO) value was checked in order to determine whether the sample size was suitable for performing EFA. The KMO value was calculated as.94, which is higher than .50 and therefore appropriate for EFA (Kaiser, 1974).
Principal component analysis was employed as the extraction method to determine the factor structure of the scale, and the Oblimin with Kaiser Normalization method was applied. The cut-off point of the items’ factor loadings was accepted as.30 (Izquierdo et al., 2014). EFA eigenvalues, parallel analysis eigenvalues, and explained variances can be seen in Table 4.
Table 4
Total Variance Explained
| Component | EFA (PCA) eigenvalues | Parallel analysis eigenvalues | % of variance | Cumulative % |
| One | 15.43 | 1.46 | 28.05 | 28.05 |
| Two | 5.61 | 1.42 | 10.20 | 38.25 |
| Three | 4.63 | 1.39 | 8.41 | 46.66 |
| Four | 2.38 | 1.37 | 4.33 | 50.99 |
| Five | 1.99 | 1.34 | 3.62 | 54.61 |
| Six | 1.83 | 1.32 | 3.33 | 57.94 |
| Seven | 1.62 | 1.30 | 2.94 | 60.88 |
| Eight | 1.46 | 1.28 | 2.66 | 63.53 |
| Nine | 1.31 | 1.26 | 2.39 | 65.92 |
Note. EFA = exploratory factor analysis; PCA = principal components analysis.
Since the data set has a normal distribution, the maximum likelihood method as parameter estimation method and covariance matrix method as the data matrix were employed. All of the t values of the items were higher than +1.96, and the t values of the indicators should differ from +-1.96, according to the literature (Kline, 2011). In addition, the error variance was less than.90, which is not high. All values were significant (p < .05). The path diagram is presented in Figure 1.
The p value of the χ2 value was examined considering the fit indices of the model. As this value is.00 (p < .05), it was accepted as a good fit. Since this value is likely to be meaningful in large sample sizes, a ratio of χ2/df and other indices should be evaluated (Tabachnick & Fidell, 2007). The χ2 value was 4112.46 (df = 1231). In this context, the ratio of χ2/df (4112.46/1231) was calculated as 3.34. Since this value was less than five, it is acceptable (Wheaton et al., 1977). Other fit indices are presented in Table 5 and examined in terms of the literature. All indices were found to be either a perfect or good fit, and only two were acceptable. In this way, the model was verified to have nine factors.
Table 5
Model Fit Measurements
| Model Fit Statistics / Indices | Model | Criteria | Decision | Rationale |
| χ2 | 4112.46 | |||
| df | 1231 | |||
| χ2/df | 3.34 | < 5 | Acceptable | Wheaton et al. (1977) |
| TLI | .92 | ≥ .92 | Good fit | Tabachnick and Fidell (2007) |
| NFI | .90 | ≥ .90 | Acceptable | Tabachnick and Fidell (2007) |
| CFI | .93 | ≥ .90 | Good fit | Tabachnick and Fidell (2007) |
| RMSEA | .05 | < .05 | Perfect fit | Hooper et al. (2008) |
| SRMR | .06 | ≤ .08 | Good fit | Hu and Bentler (1999) |
| RMR | .05 | ≤ .05 | Perfect fit | Hu and Bentler (1999) |
| AGFI | .84 | ≥ .85 | Acceptable | Schermelleh-Engel et al. (2003) |
| IFI | .93 | ≥ .90 | Good fit | Baumgartner and Homburg (1996) |
| PNFI | .83 | ≥ .50 | Good fit | Hu and Bentler (1999) |
Note. TLI = Turker-Lewis index; NFI = normed fit index; CFI = the comparative fit index; RMSEA = the root mean square error of approximation; SRMR = standardized root mean square residual; RMR = root mean square residuals; AGFI = adjusted goodness-of-fit index; IFI = the incremental fit index; PNFI = parsimony normed fit index.
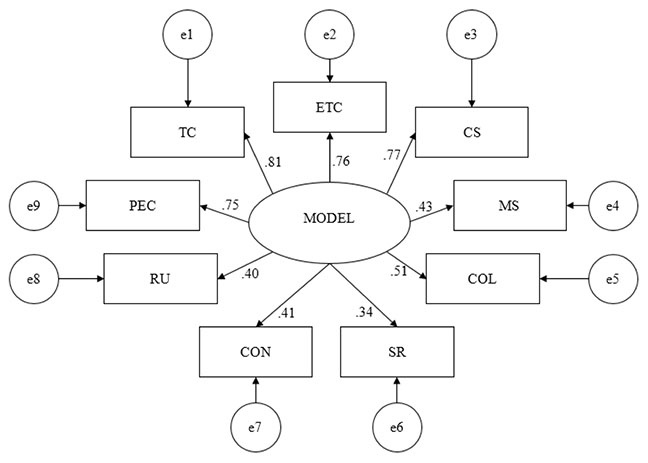
Figure 1
Confirmatory Factor Analysis Path Diagram
Note. This figure shows the factor loadings. TC = technical competence; ETC = educational technology competence; CS = computer self-efficacy; MS = management support; COL = colleague; SR = student readiness; CON = content; RU = relative usefulness; PEC = pedagogical and ethical competence.
The Cronbach alpha internal consistency coefficient ranged from.82 to.92. The AVE value of pedagogical and ethical competence factor was below .50, but it is acceptable because CR and CA were high (Table 6). After all these processes, nine factors and 52 items were included in the scale.
Table 6
AVE, CR, and CA Scores of the Factors
| Factor | AVE | CR | CA |
| Technical competence | .61 | .93 | .92 |
| Educational technology competence | .59 | .90 | .90 |
| Computer self-efficacy | .60 | .88 | .89 |
| Management support | .61 | .90 | .90 |
| Colleague | .75 | .92 | .91 |
| Student readiness | .52 | .81 | .83 |
| Content | .60 | .88 | .88 |
| Relative usefulness | .51 | .82 | .84 |
| Pedagogical and ethical competence | .44 | .86 | .86 |
Note. AVE = average variance extracted; CR = composite reliability; CA = Cronbach alpha.
As can be seen in Table 7, the total score average was 64.12 and showed a normal distribution. Since there was no normal distribution in the preschool group in the level variable, it was not included in the analysis of variance (ANOVA). Since the scores of those who answered “no” to the question “Are you technology literate?” also did not show a normal distribution, a comparison analysis was not conducted according to this variable. Comparison and correlation analyses were performed for other variables. T -tests for gender, correlation for years of service and daily device usage, and ANOVA analyses were performed for the level.
Table 7
Descriptive Statistics (Standardized Scores Between 0-100)
| Characteristic | n | M | SD | Skewness | Kurtosis |
| TOTAL | 1,128 | 64.12 | 12.11 | -0.30 | 1.17 |
| Gender | |||||
| Female | 820 | 64.35 | 11.25 | -0.13 | 0.93 |
| Male | 308 | 63.49 | 14.15 | -0.46 | 0.98 |
| Years of service | |||||
| 1-5 | 65 | 68.78 | 11.12 | -0.31 | -0.40 |
| 6-10 | 147 | 65.58 | 10.98 | -0.05 | 0.57 |
| 11-15 | 219 | 65.55 | 10.68 | 0.21 | 0.07 |
| 16-20 | 193 | 65.30 | 11.25 | -0.22 | 0.26 |
| 21 and above | 504 | 62.01 | 13.07 | -0.35 | 1.53 |
| Level | |||||
| Pre-school | 78 | 63.82 | 12.89 | -1.29 | 5.32 |
| Primary school | 387 | 63.87 | 11.99 | -0.17 | 0.67 |
| Secondary school | 394 | 64.76 | 11.65 | 0.13 | 0.04 |
| High school | 269 | 63.61 | 12.72 | -0.61 | 1.62 |
| Technology literate | |||||
| No | 166 | 54.99 | 12.74 | -0.72 | 2.34 |
| Yes | 962 | 65.69 | 11.28 | -0.05 | 0.44 |
| Daily duration | |||||
| Under 1 hr | 27 | 53.24 | 16.83 | -0.80 | 1.76 |
| 1-3 hr | 188 | 61.20 | 11.71 | -0.17 | 0.05 |
| 3-5 hr | 337 | 64.43 | 11.63 | 0.02 | 0.48 |
| More than 5 hr | 576 | 65.40 | 11.87 | -0.30 | 1.38 |
Descriptive statistics are presented in Table 8. There was no significant difference in total scores. There was a significant difference in favor of females in the colleague, content, and pedagogical and ethical competence factors and in favor of males in the technical competence factor. There was no significant difference in other factors (Table 9).
Table 8
Gender Differences in Scores
| Factor and Gender | n | M | SD |
| TOTAL | |||
| Female | 820 | 64.35 | 11.25 |
| Male | 308 | 63.49 | 14.15 |
| Technical competence | |||
| Female | 820 | 13.07 | 2.82 |
| Male | 308 | 13.52 | 3.30 |
| Educational technology competence | |||
| Female | 820 | 5.84 | 2.41 |
| Male | 308 | 6.02 | 2.79 |
| Computer self-efficacy | |||
| Female | 820 | 5.86 | 1.82 |
| Male | 308 | 6.10 | 2.14 |
| Management support | |||
| Female | 820 | 8.45 | 1.91 |
| Male | 308 | 8.20 | 2.26 |
| Colleague | |||
| Female | 820 | 6.19 | 1.17 |
| Male | 308 | 5.98 | 1.40 |
| Student readiness | |||
| Female | 820 | 3.36 | 1.61 |
| Male | 308 | 3.35 | 1.76 |
| Content | |||
| Female | 820 | 5.23 | 1.94 |
| Male | 308 | 4.92 | 2.15 |
| Relative usefulness | |||
| Female | 820 | 4.32 | 1.84 |
| Male | 308 | 4.06 | 2.05 |
| Pedagogical and ethical competence | |||
| Female | 820 | 12.02 | 1.80 |
| Male | 308 | 11.35 | 2.48 |
Table 9
T Tests by Gender
| Factor | t | df | d |
| TOTAL | 0.96 | 460.24 | |
| Technical competence | -2.12* | 485.78 | 0.15 |
| Educational technology competence | -0.97 | 488.51 | |
| Computer self-efficacy | -1.73 | 481.69 | |
| Management support | 1.77 | 480.21 | |
| Colleague | 2.36* | 477.43 | 0.16 |
| Student readiness | 0.12 | 1126.00 | |
| Content | 2.33* | 1126.00 | 0.15 |
| Relative usefulness | 1.98 | 503.80 | |
| Pedagogical and ethical competence | 4.30** | 434.72 | 0.31 |
*p < .05. **p < .01.
The correlation between years of service and scores has been examined. Apart from the relative usefulness (RU) factor, a significant and negative correlation was found between the other factor scores and the total score (Table 10). This suggests that younger teachers are more ready to teach online.
Table 10
Correlations Between Scores and Years of Service
| TOTAL | TC | ETC | CS | MS | COL | SR | CON | RU | PEC | |
| Years of service | -.15** | -.20** | -.18** | -.07* | -.11** | -.09** | .06* | -.09** | -.05 | -.10** |
Note. TC = technical competence; ETC = educational technology competence; CS = computer self-efficacy; MS = management support; COL = colleague; SR = student readiness; CON = content; RU = relative usefulness; PEC = pedagogical and ethical competence.
*p < .05. **p < .01.
Preschool level is not included in ANOVA because it did not show normal distribution (Table 7). Homogeneity of variances assumption was met except management support factor (Table 12), therefore ANOVA couldn’t be conducted for it. According to the Welch test results F = 2.58 (p > 0.05), there was no significant difference among the groups for this factor.
Table 11
School Level Differences in Scores
| Factor and Level | n | M | SD |
| TOTAL | |||
| PS | 387 | 63.87 | 12.00 |
| SS | 394 | 64.76 | 11.65 |
| HS | 269 | 63.61 | 12.72 |
| Total | 1050 | 64.14 | 12.06 |
| Technical competence | |||
| PS | 387 | 12.99 | 2.95 |
| SS | 394 | 13.34 | 2.74 |
| HS | 269 | 13.48 | 3.18 |
| Educational technology competence | |||
| PS | 387 | 5.76 | 2.44 |
| SS | 394 | 6.06 | 2.52 |
| HS | 269 | 5.92 | 2.64 |
| Computer self-efficacy | |||
| PS | 387 | 5.77 | 1.88 |
| SS | 394 | 5.91 | 1.90 |
| HS | 269 | 6.19 | 1.95 |
| Management support | |||
| PS | 387 | 8.32 | 2.06 |
| SS | 394 | 8.58 | 1.83 |
| HS | 269 | 8.16 | 2.21 |
| Colleague | |||
| PS | 387 | 6.17 | 1.15 |
| SS | 394 | 6.14 | 1.21 |
| HS | 269 | 6.02 | 1.36 |
| Student readiness | |||
| PS | 387 | 3.62 | 1.66 |
| SS | 394 | 3.30 | 1.66 |
| HS | 269 | 2.97 | 1.55 |
| Content | |||
| PS | 387 | 5.05 | 2.06 |
| SS | 394 | 5.19 | 2.04 |
| HS | 269 | 5.12 | 1.91 |
| Relative usefulness | |||
| PS | 387 | 4.32 | 1.86 |
| SS | 394 | 4.32 | 1.94 |
| HS | 269 | 4.10 | 1.95 |
| Pedagogical and ethical competence | |||
| PS | 387 | 11.89 | 1.97 |
| SS | 394 | 11.92 | 1.88 |
| HS | 269 | 11.65 | 2.21 |
Note. PS = primary school; SS = secondary school; HS = high school.
Table 12
Tests of Homogeneity of Variances
| Factor | Levene Statistic | df 1 | df 2 |
| TOTAL | 0.30 | 2 | 1047 |
| Technical competence | 2.29 | 2 | 1047 |
| Educational technology competence | 0.75 | 2 | 1047 |
| Computer self-efficacy | 0.34 | 2 | 1047 |
| Management support | 5.16* | 2 | 1047 |
| Colleague | 1.06 | 2 | 1047 |
| Student readiness | 0.57 | 2 | 1047 |
| Content | 0.88 | 2 | 1047 |
| Relative usefulness | 1.20 | 2 | 1047 |
| Pedagogical and ethical competence | 1.56 | 2 | 1047 |
*p < .05.
Considering the levels, there was no significant difference between the total score averages. Considering the factor score averages, significant differences were found only for the computer self-efficacy and student readiness factors (Table 13). Post-hoc tests were conducted for these factors.
Table 13
Analysis of Variance Statistics by Teaching Level
| Factor and groups | SS | df | MS | F | η2 |
| TOTAL | |||||
| Between groups | 256.93 | 2 | 128.46 | 0.88 | |
| Within groups | 152217.16 | 1047 | 145.38 | ||
| Total | 152474.09 | 1049 | |||
| Technical competence | |||||
| Between groups | 44.93 | 2 | 22.46 | 2.60 | |
| Within groups | 9037.75 | 1047 | 8.63 | ||
| Total | 9082.68 | 1049 | |||
| Educational technology competence | |||||
| Between groups | 18.20 | 2 | 9.10 | 1.43 | |
| Within groups | 6646.12 | 1047 | 6.35 | ||
| Total | 6664.32 | 1049 | |||
| Computer self-efficacy | |||||
| Between groups | 28.28 | 2 | 14.14 | 3.88* | .01 |
| Within groups | 3815.32 | 1047 | 3.64 | ||
| Total | 3843.61 | 1049 | |||
| Colleague | |||||
| Between groups | 3.85 | 2 | 1.92 | 1.28 | |
| Within groups | 1578.66 | 1047 | 1.51 | ||
| Total | 1582.51 | 1049 | |||
| Student readiness | |||||
| Between groups | 66.35 | 2 | 33.18 | 12.43** | .02 |
| Within groups | 2794.80 | 1047 | 2.67 | ||
| Total | 2861.16 | 1049 | |||
| Content | |||||
| Between groups | 3.74 | 2 | 1.87 | 0.46 | |
| Within groups | 4249.10 | 1047 | 4.06 | ||
| Total | 4252.84 | 1049 | |||
| Relative usefulness | |||||
| Between groups | 9.70 | 2 | 4.85 | 1.32 | |
| Within groups | 3840.33 | 1047 | 3.67 | ||
| Total | 3850.04 | 1049 | |||
| Pedagogical and ethical competence | |||||
| Between groups | 13.33 | 2 | 6.67 | 1.66 | |
| Within groups | 4208.11 | 1047 | 4.02 | ||
| Total | 4221.44 | 1049 | |||
*p < .05. **p < .01.
Considering the post-hoc tests, there was a significant difference between primary school and high school for the computer self-efficacy factor in favor of high school. There was a significant difference between all groups for the student readiness factor. The score for primary school is highest, the second highest score is for secondary school, and the lowest score is for high school (Table 14 and Table 15).
Table 14
Post-Hoc (Bonferroni) Results
| Dependent variable | (I) level | (J) level | MD |
| Computer self-efficacy | PS | SS | -0.14 |
| HS | -0.42* | ||
| SS | PS | 0.14 | |
| HS | -0.28 | ||
| HS | PS | 0.42* | |
| SS | 0.28 | ||
| Student readiness | PS | SS | 0.32* |
| HS | 0.64** | ||
| SS | PS | -0.32* | |
| HS | 0.32* | ||
| HS | PS | -0.64** | |
| SS | -0.32* |
Note. PS = primary school; SS = secondary school; HS = high school.
* p < .05. ** p < .01.
As can be seen from Table 15, a low-level and positive relationship was found between the total score and the factors of technical competence, educational technology competence, computer self-efficacy, relative usefulness, and pedagogical and ethical competence according to the duration of daily technological device use. As the usage time increased, the rate of readiness increased.
Table 15
Correlation Between Scores and Daily Device Usage Time
| TOTAL | TC | ETC | CS | MS | COL | SR | CON | RU | PEC | |
| Daily device usage time | .17** | .20** | .17** | .16** | 0.04 | 0.03 | 0.03 | 0.02 | 0.07* | .16** |
Note. TC = technical competence; ETC = educational technology competence; CS = computer self-efficacy; MS = management support; COL = colleague; SR = student readiness; CON = content; RU = relative usefulness; PEC = pedagogical and ethical competence.
*p < .05. ** p < .01.
The scales for e-learning readiness show the necessity of examining the e-learning readiness of teachers within a more comprehensive structure. There are some studies on e-learning readiness in the literature. For example, Aydın and Tascı (2005) stated that human resource readiness is an important factor in e-learning effectiveness. Other studies have focused on technological readiness and organizational readiness.
According to the technical competence factor, the nine items here are largely related to readiness. The factor load was .81 (Figure 1). It was observed that items on computer and Internet use skills in general are particularly important in terms of readiness (items three, five, six, and seven). One of the most vital factors affecting e-learning outcomes is technical competence (Eslaminejad et al., 2010; Gay, 2016; Keramati et al., 2011; Ouma, 2013). Yun and Murad (2006) also stated that one of the most important barriers preventing the readiness of secondary school teachers is the lack of technical skills.
The educational technology competence factor, which consisted of six items, had a load of .76 (Figure 1), and this factor is important in terms of readiness. The items of online collaboration and using online exam/quiz tools were particularly important in terms of readiness (items 12 and 16). Educators’ technical skills are an important factor; if the e-learning participants do not have the necessary skills to use the technology and learn the content, the e-learning process will not be successful (Berge et al., 2000). When it comes to designing e-learning environments and using tools for this environment, teachers need to have educational technology competence (Eslaminejad et al., 2010).
Computer self-efficacy, which had five items, had a load of .77 (Figure 1), and this factor is important in terms of readiness. It has been observed that providing technical support, giving sufficient time, and providing practical training are especially important in terms of readiness (items 17, 18, and 19). Agboola (2006) pointed out that education was an important factor in supporting the e-learning readiness of staff in a positive way. It is therefore important to determine the computer self-efficacy of educators (Hung et al., 2010). Having basic computer skills and a high computer self-efficacy perception is one of the factors affecting students’ success in online learning environments (Çelen et al., 2011). Gay (2016) revealed that instructors need an online help desk for technical support. Giving sufficient time is also mentioned in the literature. Martin, Budhrani, et al. (2019) stated that less experienced lecturers in particular may need extra time not only to prepare for online learning but also to acquire the skills necessary for online learning, and therefore may experience time constraints. Online education is more time consuming and teachers should be particularly prepared in terms of time management. The subject of time management is of particular concern to female teachers (Martin, Budhrani, et al., 2019).
The load of the colleagues factor was .51 (Figure 1), and it is moderately important for readiness. Cooperation and help between colleagues were important in terms of readiness (items 28 and 29). Yun and Murad (2006) revealed that colleagues sharing knowledge and technical skills regarding e-learning has a positive effect on teachers’ readiness.
It can be said that management support, student readiness, content, and relative usefulness factors were all lower than .50 (Figure 1), and readiness was less related here than in other factors. In the management support factor, preparation of the curriculum with consideration of teachers’ and students’ needs was an item that had a greater impact on readiness when compared to other factors (item 23). Barefoot (2004) found that institutional support is a crucial element in learning persistence. According to research, institutional elements such as technological support, pedagogical assistance, and the school vision for the adoption of online or blended learning can all have an impact on the effectiveness of online teaching (Almpanis, 2015; Bao, 2020). According to Howard et al. (2021), strong leadership and unambiguous support for incorporating new technology and practices in teaching and learning can inspire teachers to change, but a lack of organizational commitment to change can demotivate teachers and impede change.
In the student readiness factor, both high interest in online learning and a high use of their time are the most important items (items 33 and 34). In the content factor, adequate technical support of the Ministry of National Education in Turkey and in-service training for teachers were found to be more important than other items (items 37 and 38). So and Swatman (2006) found that student readiness, teacher readiness, technological support, managerial support, and school culture are factors that affect the e-learning process.
Finally, in the relative usefulness factor, teachers’ readiness was higher if they thought that online education is efficient and effective (items 42 and 43). According to Engholm and McLean (2002), organizational support and training and development are key factors in a successful e-learning process. Akaslan and Law (2011) also emphasized managerial support.
The load of the pedagogical (professional) and ethical competency factor was .75 (Figure 1), and this factor is important for readiness. In particular, the ability to communicate with colleagues online has been found to be important in terms of readiness (item 50). Pedagogical readiness is also related to computer skills (Eslaminejad et al., 2010) in the case of, for example, designing online material. Teaching in e-learning environments requires skills, and replicating the methods and materials of face-to-face classroom settings is not an adequate substitute (Mercado, 2008).
According to the mean scores by gender, there is no significant difference in the total score. This result contrasts with the results of instructors at the university level found in previous research. For example, the average score of females in e-learning readiness has been shown to be lower than that of males (Akaslan & Law, 2011).
A significant difference was found in favor of males in the technical competence factor and in favor of females in the colleague, content, and pedagogical and ethical competence factors. The higher the technical competence factor score of males can be attributed to their high interest in using technology, computers, and Internet tools. This finding is supported by research by Sáinz and López-Sáez (2010). Female teachers feel less comfortable and less secure when it comes to technical matters (Correa, 2010). Similarly, So and Swatman (2006) found that male teachers have high confidence in IT proficiency and feel ready to learn, despite receiving the same IT training. According to a study by Çınar et al. (2021), males have a higher level of e-learning readiness in K-12 schools. Considering the factors in which females ranked higher, these are related to professional-ethical competencies and sociality. In parallel with this, So and Swatman (2006) revealed a significant difference in favor of female teachers in aspects such as teamwork and sharing. Supporting this finding, female instructors have perceived communication and technical competencies as more important than have male instructors (Martin, Wang, et al., 2019).
Martin, Budhrani, et al. (2019) revealed that female instructors’ perceptions of course design, communication, and time management were significantly higher than male instructors’. Differences in male and female communication styles affect the way faculties communicate online. Time management is also a more crucial concern for women, especially among those with family.
Considering the relationship between years of service and readiness, there was a negative and significant relationship with all factors except relative usefulness. The readiness of younger teachers was generally higher. This situation mostly affects the technical competence and educational technology competence factors. This may have been caused by the interest and knowledge of teachers in technology and educational technology, especially during their initial years in the profession. Le et al. (2014) stated that older teachers may take time to get used to technologies such as the LMS when compared to younger teachers who are more familiar with technology.
There was no significant difference in the total score according to educational level which were primary, secondary, and high schools. However, on a factor basis, there was only a significant difference in the factors of computer self-efficacy and student readiness according to educational level. In the computer self-efficacy factor, high school teachers had a significantly higher level of readiness than primary school teachers. The reason for this may be that high school teachers are required to use technology more in their lessons/administrative activities. Similarly, So and Swatman (2006) revealed that although the opportunities and training offered to primary and secondary school teachers are the same, primary school teachers think they know less about e-learning than secondary school teachers.
A surprising result is that primary school teachers have higher student readiness than secondary and high school teachers. The reason for this may be that primary school students use technology less in daily life and the innovation effect that technology has. In contrast, So and Swatman (2006) found that primary school teachers think their students are not ready.
There was a low correlation between readiness and daily technological device use. In particular, technological competence, educational technology competence, computer self-efficacy, relative usefulness, and pedagogical competence and readiness were relevant. As the use of devices increased, technology-related readiness in particular increased. As teachers use devices, their familiarity increases so they feel more prepared to use different technologies. In line with this, Phan and Dang (2017) highlighted that in order for teachers to be facilitators in the online learning process, teachers should use learning management systems (LMS), live conference systems, etc., which have to be made available by administrations.
It is vital for teachers to be prepared for online teaching. This study examined teacher preparedness. The purpose of this study was twofold: to develop a scale to measure K-12 teachers’ e-learning readiness, and to examine their readiness to teach online. The e-learning readiness scale developed in this study and analyzed for validity and reliability is expected to guide and support future studies on these issues. The measurement of readiness of teachers for the e-learning process plays an important role in terms of determining future strategies, measures, and interventions that need to be taken. Every variable that increases the quality of e-learning is of great importance scientifically for increasing the quality of the process and student achievement.
The study included a large sample size. Also, teachers from different districts were included, exhibiting different characteristics and cultures. However, it is a limitation that teachers from different geographical regions were not included. Future research should examine the readiness of teachers in various geographic regions. Studies can be carried out by collecting data from different schools, and the findings can be compared with the findings of this research. In future studies, mobile learning readiness can also be investigated, examining the increase in teachers’ use of smart phones. Based on the results of the research, qualitative studies can also be carried out in order to obtain deeper data. Research could look at the effect of teachers’ e-learning readiness level on teachers’ online teaching performance. Studies could also be conducted on how administrators can encourage teachers in the online learning process, involve teachers in the online learning process, and motivate them.
It is important to evaluate the readiness of teachers and design training accordingly. Teachers take on tasks such as preparing online content, applying methods for online learning, and motivating students through interaction. In order to ensure readiness, teachers should be equipped with these competencies. Training on how to use applications and application tools such as LMSs and other tools suitable for their courses will be useful. Courses should not focus solely on technical skills but should also include topics such as educational technology competencies, effective use of time, how to engage and motivate students, and methodologies to be used in e-learning environments. Continuous training is recommended rather than one-off training. Furthermore, it is not only in-service training that is important. Pre-service training in the content of courses given in education faculties should be enriched, and the e-learning readiness of pre-service teachers should be increased by giving practical lessons.
Since the role of school administrators as technology leaders is also very important, they should also be given theoretical and practical training. Administrators should be guided on how to support and encourage teachers in the e-learning process.
Support from technical personnel is required for better implementation of e-learning. In addition, educational technologists in schools must play a role in the execution of e-learning. Again, infrastructure problems such as Internet speed should be tackled as much as possible by policy makers.
In order to increase the collaboration of teachers with their colleagues, online platforms can be established where teachers can help one another with e-learning. Teachers with more experience can be assigned as e-mentors.
The study has implications for teachers who teach online, for instructional designers who design online learning environments, and for administrators and policy makers who support online learning at K-12. The study can also guide policy makers and educational institutions by shedding light on the dimensions of e-learning readiness that can contribute to the success of e-learning.
Agboola, A. K. (2006). Assessing the awareness and perceptions of academic staff in using e-learning tools for instructional delivery in a post-secondary institution: A case study. The Innovation Journal: The Public Sector Innovation Journal, 11(3), 1-12. https://www.innovation.cc/scholarly-style/2006_11_3_4_agboola_islamic-university.pdf
Akaslan, D., & Law, E. L. C. (2011). Measuring teachers’ readiness for e-learning in higher education institutions associated with the subject of electricity in Turkey. In Proceedings of 2011 IEEE Global Engineering Education Conference: Learning environments and ecosystems in engineering education (pp. 481-490). IEEE. https://doi.org/10.1109/EDUCON.2011.5773180
Al-Furaydi, A. A. (2013). Measuring e-learning readiness among EFL teachers in intermediate public schools in Saudi Arabia. English Language Teaching, 6(7), 110-121. http://doi.org/10.5539/elt.v6n7p110
Almpanis, T. (2015). Staff development and institutional support for technology enhanced learning in UK universities. The Electronic Journal of E-Learning, 13(5), 381-389. https://academic-publishing.org/index.php/ejel/article/view/1940/1903
Amalia, R. R., Anggoro, S., & Eka, K. I. (2021). Identification of teachers and students’ readiness to e-learning implementation. Journal of Teaching and Learning in Elementary Education (JTLEE), 4(2), 170-179. https://jtlee.ejournal.unri.ac.id/index.php/JTLEE/article/download/7884/6822
Aydin, C., & Tasci, D. (2005). Measuring readiness for e-learning: Reflections from an emerging country. Educational Technology & Society, 8(4), 244-257. https://www.jstor.org/stable/jeductechsoci.8.4.244
Bao, W. (2020). COVID-19 and online teaching in higher education: A case study of Peking University. Human Behavior and Emerging Technologies, 2(2), 113-115. https://doi.org/10.1002/hbe2.191
Barefoot, B. O. (2004). Higher education’s revolving door: Confronting the problem of student drop out in U.S. colleges and universities. Open Learning, 19(1), 9-18. https://doi.org/10.1080/0268051042000177818
Baumgartner, H., & Homburg, C. (1996). Applications of structural equation modeling in marketing and consumer research: A review. International Journal of Research in Marketing, 13(2), 139-161. https://doi.org/10.1016/0167-8116(95)00038-0
Berge, Z. L., Collins, M., & Dougherty, K. (2000). Design guidelines for web-based courses. In B. Abbey (Ed.), Instructional and Cognitive Impacts of Web-Based Education (pp. 32-40). IGI Global. http://doi.org/10.4018/978-1-878289-59-9.ch002
Correa, T. (2010). The participation divide among “online experts”: Experience, skills, and psychological factors as predictors of college students’ web content creation. Journal of Computer-Mediated Communication, 16(1), 71-92. https://doi.org/10.1111/j.1083-6101.2010.01532.x
Çelen, F. K., Çelik, A., & Seferoğlu, S. S. (2011). Yükseköğ retimde çevrimiçi öğ renme: sistemde yaşanan sorunlar ve çözüm önerileri [Education in higher education: Problems experienced and solution suggestions]. Journal of European Education, 1(1), 25-34. http://www.ajindex.com/dosyalar/makale/acarindex-1423906196.pdf
Çiğdem, H., & Topcu, A. (2015). Predictors of instructors’ behavioral intention to use learning management system: A Turkish vocational college example. Computers in Human Behavior, 52, 22-28. https://doi.org/10.1016/j.chb.2015.05.049
Çınar, M., Ekici, M., & Demir, Ö. (2021). A snapshot of the readiness for e-learning among in-service teachers prior to the pandemic-related transition to e-learning in Turkey. Teaching and Teacher Education, 107(2021), 1-10. https://doi.org/10.1016/j.tate.2021.103478
Demir, Ö., & Yurdugül, H. (2015). The exploration of models regarding e-learning readiness: Reference model suggestions. International Journal of Progressive Education, 11(1), 173-194. https://ijpe.inased.org/makale_indir/2420
Engholm, P., & McLean, J. J. (2002). What determines an organisation's readiness for e-learning? In A. Green (Ed.), E-business in Australia: Concepts and cases (pp. 200 - 212). Pearson Australia Group.
Eslaminejad, T., Masood, M., & Ngah, N. A. (2010). Assessment of instructors’ readiness for implementing e-learning in continuing medical education in Iran. Medical Teacher, 32(10), 407-412. https://doi.org/10.3109/0142159X.2010.496006
Field, A. P. (2009). Discovering statistics using SPSS: And sex and drugs and rock ‘n’ roll. Sage.
Gay, G. H. E. (2016). An assessment of online instructor e-learning readiness before, during, and after course delivery. Journal of Computing in Higher Education, 28(2), 199-220. https://doi.org/10.1007/s12528-016-9115-z
Gurley, L. E. (2018). Educators’ preparation to teach, perceived teaching presence, and perceived teaching presence behaviors in blended and online learning environments. Online Learning, 22(2), 179-220. https://doi.org/10.24059/olj.v22i2.1255
Hong, Y. & Gardner, L. (2018). An exploration of undergraduates’ preparedness and experiences in blended courses. In M. Tanabu & D. Senoo (Eds.), PACIS 2018 proceedings. Article 156. Association for Information Systems (AIS). https://aisel.aisnet.org/pacis2018/156
Hooper, D., Coughlan, J., & Mullen, M. (2008). Structural equation modelling: Guidelines for determining model fit. Electronic Journal of Business Research Methods, 6(1), 53-60. https://academic-publishing.org/index.php/ejbrm/article/view/1224/1187
Howard, S. K., Tondeur, J., Siddiq, F., & Scherer, S. (2021). Ready, set, go! Profiling teachers’ readiness for online teaching in secondary education. Technology, Pedagogy and Education, 30(1), 141-158. https://doi.org/10.1080/1475939X.2020.1839543
Hu, K., AlSaqqaf, A., & Swanto, S. (2020). E-learning readiness among English teachers in Malaysia: A pilot study. Journal of English Language Teaching Innovations and Materials, 2(2), 120-127. http://dx.doi.org/10.26418/jeltim.v2i2.42155
Hu, L., & Bentler, P. M. (1999). Cutoff criteria for fit indexes in covariance structure analysis: Conventional criteria versus new alternatives. Structural Equation Modeling, 6(1), 1-55. https://doi.org/10.1080/10705519909540118
Hung, M.-L., Chou, C., Chen, C.-H., & Own, Z.-Y. (2010). Learner readiness for online learning: Scale development and student perceptions. Computers & Education, 55(3), 1080-1090. https://doi.org/10.1016/j.compedu.2010.05.004
Izquierdo, I., Olea, J., & Abad, F. J. (2014). Exploratory factor analysis in validation studies: Uses and recommendations. Psicothema, 26(3), 395-400. https://doi.org/10.7334/psicothema2013.349
Johnson, S. G., & Berge, Z. (2012). Online education in the community college. Community College Journal of Research and Practice, 36(11), 897-902. https://doi.org/10.1080/10668920903323948
Kaiser, H. F. (1974). An index of factorial simplicity. Psychometrika, 39, 31-36. https://doi.org/10.1007/BF02291575
Keramati, A., Afshari-Mofrad, M., & Kamrani, A. (2011). The role of readiness factors in e-learning outcomes: An empirical study. Computers & Education, 57(3), 1919-1929. https://doi.org/10.1016/j.compedu.2011.04.005
Kline, R. B. (2011). Principles and practice of structural equation modeling (3rd ed.). Guilford Publications.
Koloseni, D., & Mandari, H. (2017). The role of personal traits and learner’s perceptions on the adoption of e-learning systems in higher learning institutions. African Journal of Finance and Management, 26(1), 61-75. https://www.researchgate.net/publication/319980804_The_Role_of_Personal_Traits_and_Learner%27s_Perceptions_on_the_Adoption_of_E-learning_Systems_in_Higher_Learning_Institutions
Le, H. K., Sriratanaviriyakul, N., Nkhoma, M., & Vo, H. X. (2014). Ho Chi Minh City Open University: IT governance in Vietnamese higher education. Journal of Information Technology Education: Discussion Cases, 3(1), 1-11. https://doi.org/10.28945/2055
Lopes, C. (2007). Evaluating E-learning readiness in a health sciences higher education institution. Paper presented at the proceedings of IADIS international conference of E-learning, Portugal.
Martin, F., Budhrani, K., & Wang, C. (2019). Examining faculty perceptions of their readiness to teach online. Online Learning, 23(3), 97-119. https://doi.org/10.24059/olj.v23i3.1555
Martin, F., Wang, C., Jokiaho, A., May, B., & Grübmeyer, S. (2019). Examining faculty readiness to teach online: A comparison of US and German educators. European Journal of Open, Distance and E-learning, 22(1), 53-69. https://doi.org/10.2478/eurodl-2019-0004
Mercado, C. (2008, December 11-12). Readiness assessment tool for an e-learning environment implementation [Conference session]. Fifth International Conference on E-Learning for Knowledge-Based Society, Bangkok, Thailand. http://ijcim.th.org/SpecialEditions/v16nSP3/18_fullpaper_cecilia%20Mercado_Revised.pdf
Mirabolghasemi, M., Choshaly, S. H., & Iahad, N. A. (2019). Using the HOT-fit model to predict the determinants of e-learning readiness in higher education: A developing country’s perspective. Education and Information Technologies, 24(6), 3555-3576. https://doi.org/10.1007/s10639-019-09945-9
Moftakhari, M. M. (2013). Evaluating e-learning readiness of faculty of letters of Hacettepe [Unpublished master’s thesis]. Hacettepe University.
Obara, J. K., & Abulokwe, A. C. (2012). Utilization of e-learning for effective teaching of vocational education courses in Nigeria. International Journal of Research Development (Global Academic Group), 7(1), 1-8. https://www.globalacademicgroup.com/journals/approaches/Utilization%20of%20E-Learning%20for%20Effective%20Teaching%20of%20Vocation.pdf
Oketch, H., Njihia, J., & Wausi, A. (2014). E-learning readiness assessment model in Kenya’s higher education institutions: A case study of University of Nairobi. International Journal of Scientific Knowledge, 5(6), 29-41. https://profiles.uonbi.ac.ke/njihia/files/elearning_readiness__assessment_model_in_kenya.pdf
Ouma, G. O. (2013). E-learning readiness in public secondary schools in Kenya. European Journal of Open, Distance and E-learning, 16(2), 97-110. https://files.eric.ed.gov/fulltext/EJ1017522.pdf
Pallant, J. (2007). SPSS survival manual: A step by step guide to data analysis using SPSS for Windows. Open University Press.
Paturusi, S., Chisaki, Y., & Usagawa, T. (2015). Assessing lecturers’ and students’ readiness for e-learning: A preliminary study at national university in North Sulawesi Indonesia. GSTF Journal on Education (JEd), 2(2), 1-8. https://doi.org/10.5176/2345-7163_2.2.50
Phan, T. T. N., & Dang, L. T. T. (2017). Teacher readiness for online teaching: A critical review. International Journal Open Distance E-Learning, 3(1), 1-16. https://ijodel.com/wp-content/uploads/2017/12/001_Phan_Dang.pdf
Pusparini, K. S., Made Hery Santosa, S. P., & Myartawan, I. P. N. W. (2018). An investigation on teachers’ e-learning readiness toward e-learning implementation in public senior high schools. Journal Pendidikan Bahasa Inggris Undiksha, 5(2), 1-10. https://ejournal.undiksha.ac.id/index.php/JPBI/article/download/15160/9263
Sáinz, M., & López-Sáez, M. (2010). Gender differences in computer attitudes and the choice of technology-related occupations in a sample of secondary students in Spain. Computers & Education, 54(2), 578-587. https://doi.org/10.1016/j.compedu.2009.09.007
Schermelleh-Engel, K., Moosbrugger, H., & Müller, H. (2003). Evaluating the fit of structural equation models: Tests of significance and descriptive goodness-of-fit measures. Methods of psychological research online, 8(2), 23-74. https://www.researchgate.net/publication/251060246_Evaluating_the_Fit_of_Structural_Equation_Models_Tests_of_Significance_and_Descriptive_Goodness-of-Fit_Measures
Setati, P. P., & Paledi, V. N. (2019). Conceptualised framework for assessing teachers’ e-learning readiness in South African rural schools. In N. M. Ochara & J. N. Odhiambo (Eds.), 2019 Open Innovations Conference (pp. 320-330). IEEE. https://www.doi.org/10.1109/OI.2019.8908204
So, T., & Swatman, P. M. (2006). E-learning readiness of Hong Kong teachers. University of South Australia. https://nurhadiw.files.wordpress.com/2010/08/swatman.pdf
Summak, M. S., Bağlıbel, M., & Samancıoğlu, M. (2010). Technology readiness of primary school teachers: A case study in Turkey. Procedia - Social Behavior Science, 2(2), 2671-2675. https://doi.org/10.1016/j.sbspro.2010.03.393
Tabachnick, G. G., & Fidell, L. S. (2007). Experimental designs using ANOVA. Duxbury Press.
Texas A&M University. (2021). Readiness for Online Teaching Survey. https://www.tamut.edu/Training/downloads/Readiness_Survey.xlsx
Trayek, F. A., Ahmad, T. B. T., Nordin, M. S., Dwikat, M. A., Abulibdeh, E. S. A., Asmar, M., & Sawari, S. S. M. (2016). Underlying structure of e-learning readiness among Palestinian secondary school teachers. MATEC Web of Conferences: 2016 8th International Conference on Computer and Automation Engineering, 56, Article 01011. https://doi.org/10.1051/matecconf/20165601011
University of Toledo. (2021). Faculty Online Teaching Readiness Survey. https://www.utdl.edu/lv/assessments/faculty_readiness.html
Wheaton, B., Muthen, B., Alwin, D. F., & Summers, G. F. (1977). Assessing reliability and stability in panel models. Sociological Methodology, 8(1), 84-136. https://doi.org/10.2307/270754
Yun, G. P., & Murad, M. W. (2006). Factors influencing psychology and skills of the secondary school teachers’ e-learning readiness: A case study in Malacca, Malaysia. In Current developments in technology-assisted education (pp. 2135-2140). Formatex. http://library.oum.edu.my/oumlib/sites/default/files/file_attachments/odl-resources/4304/factors-influencing.pdf
Yusof, M. M., Kuljis, J., Papazafeiropoulou, A., & Stergioulas, L. K. (2008). An evaluation framework for health information systems: Human, organization and technology-fit factors (HOT-fit). International Journal of Medical Informatics, 77(6), 386-398. https://doi.org/10.1016/j.ijmedinf.2007.08.011
Zheng, Y., Wang, J., Doll, W., Deng, X., & Williams, M. (2018). The impact of organisational support, technical support, and self-efficacy on faculty perceived benefits of using learning management system. Behaviour & Information Technology, 37(4), 311-319. https://doi.org/10.1080/0144929X.2018.1436590
Ziphorah, R. M. (2014). Information and communication technology integration: Where to start, infrastructure or capacity building? Procedia—Social and Behavioral Sciences, 116, 3649-3658. https://doi.org/10.1016/j.sbspro.2014.01.818

Are K-12 Teachers Ready for E-learning? by Elif Polat, Sinan Hopcan, and Ömer Yahşi is licensed under a Creative Commons Attribution 4.0 International License.