Volume 23, Number 4
Ean Teng Khor1 and Darshan Dave2
1National Institute of Education, Nanyang Technological University; 2Centre for Research and Development in Learning, Nanyang Technological University
The COVID-19 pandemic induced a digital transformation of education and inspired both instructors and learners to adopt and leverage technology for learning. This led to online learning becoming an important component of the new normal, with home-based virtual learning an essential aspect for learners on various levels. This, in turn, has caused learners of varying levels to interact more frequently with virtual resources to supplement their learning. Even though virtual learning environments provide basic resources to help monitor the learners’ online behaviour, there is room for more insights to be derived concerning individual learner performance. In this study, we propose a framework for visualising learners’ online behaviour and use the data obtained to predict whether the learners would clear a course. We explored a variety of binary classifiers from which we achieved an overall accuracy of 80%-85%, thereby indicating the effectiveness of our approach and that learners’ online behaviour had a significant effect on their academic performance. Further analysis showed that common patterns of behaviour among learners and/or anomalies in online behaviour could cause incorrect interpretations of a learner’s performance, which gave us a better understanding of how our approach could be modified in the future.
Keywords: social network analysis, machine learning, binary classifiers, supervised and ensemble learning algorithms, virtual resources interactions, learners’ academic performance
Virtual learning environments (VLE) have replaced physical classrooms in various institutions and have been widely adopted by instructors and learners of various levels worldwide due to the COVID-19 pandemic. The resources provisioned by course providers and/or instructors in these environments are used to supplement learners’ learning and/or assess their understanding of the course material they have been taught up to a certain point in time. Virtual resources contribute to a learner’s academic performance in educational institutions worldwide. Therefore, learners’ behaviour within an online environment, for example, how they interact with such virtual resources, could help us study whether any correlation exists between their online activity and their performance in a course. Learning behaviour can be examined with the application of big data techniques to promote learner success (Khor and Looi, 2019). Hence, the purpose of this study was to model the behaviours of learners in a VLE and explore whether we could leverage big data techniques and use learners’ interactions with virtual learning resources to predict whether a learner is successful in clearing a course, thereby helping us to understand how their behaviour in a virtual environment affects their academic achievement.
Social network analysis (SNA) is a means to examine social structures with the aid of networks and graph theory (Grunspan et al., 2014; Otte & Rousseau, 2002). The structures, commonly referred to as sociograms, are analysed with nodes as points, representing people or other entities of interest in the network, and ties or edges as lines, which are usually relationships or interactions between the entities. This method of visualising social structures allows us to quantitatively and qualitatively analyse them to derive valuable insights. SNA has been applied in education research to examine how learners form relationships through learning and how these relationships affect their learning outcomes. For example, SNA has been applied to understand the structure of the study networks formed between learners in an undergraduate class and how it could ultimately influence individual learners’ academic performance (Grunspan et al., 2014). On the other hand, Rabbany et al. (2012) have applied SNA to understand learner interactions where social mining and other SNA techniques were exploited to discover structures in the network graphs generated from the manner and content of interactions between the learners. The study provides instructors with insight to better visualise the interactions among the learners, have a better understanding of the main influencers, and give them a better understanding of learner participation, especially with courses that rely on virtual resources.
Chung and Paredes (2015) have developed a social network model for online learning and performance. The authors analysed social learning in an e-learning environment and used SNA to demonstrate how the properties of a learner’s social network, along with the learner’s contribution towards the learning of others and the content of their contribution, impact the learning and performance of others. Meanwhile, Dragulescu et al. (2015) make use of various tools to query the social interactions from various data sources and run SNA on the queries to show it can be used to model the interactions using data from a pool of resources.
A study conducted by Saqr et al. (2018) shows how online interaction data can be collated and processed in order to use SNA to study how collaboration between peers in a course influences performance. Furthermore, Rakic et al. (2018) explore how SNA can be used to study and analyse the use of virtual resources on an e-learning platform to find vital indicators of learner performance in different courses. Rakic et al. (2019, 2020) further developed this study by using SNA with other machine learning methods. In all these studies, the use of resources on the e-learning platform was found to contribute significantly to a learner’s performance.
Learning analytics, along with machine learning, has been applied to an assortment of institutions’ VLE data to help predict learner performance and understand factors affecting it. Koza et al. (1996) and Mitchell (1997) describe machine learning as the construction and usage of algorithms that leverage data to make predictions or decisions and improve performance in the automation of specific tasks.
The most basic approaches in machine learning make use of either supervised or unsupervised learning. For predictive tasks or data classification, supervised learning makes use of labelled data to train algorithms to learn how to predict outcomes or classify the data, while unsupervised learning finds patterns within unlabelled data to learn how to cluster or split the data into different groups. Ensemble techniques in either supervised or unsupervised learning use various learning algorithms to improve predictive or classification performance compared with that obtained with just a single supervised or unsupervised learning algorithm. The machine learning approach to be used in a task is based on the objective and the data that has been made available.
Wolff et al. (2013) have leveraged learning analytics methods to develop models to predict at-risk learners based on their behaviour within VLEs and their demographic data. Al-Azawei and Al-Masoudy (2020) have also developed a predictive model that used behavioural data from VLEs along with assessment scores and demographic data to predict academic performance. Clickstream data from the VLE can also be used to predict at-risk learners with the application of deep learning techniques (Waheed et al. 2020).
Rivas et al. (2021) employ machine learning to understand the key factors behind a learner’s performance, while Agudo-Peregrina et al. (2012) use learning analytics to study the different types of interactions within a VLE and how each type of interaction influences the academic performance of the learners. Mariame, et al. (2021) also show how machine learning can be used to find the best features for predicting learner performance; de Barba et al. (2016) use learning analytics and data mining to show how motivation and participation were key contributors to learners’ performance in an online course.
Sekeroglu et al. (2019) combine educational data mining and machine learning algorithms to effectively predict and classify the academic performance of learners. The results of the study indicate that performance can be improved by experimenting with different types of features and algorithms. Albreiki et al. (2021) also use these techniques on data from e-learning platforms to study how effective it is in identifying learners who need assistance and/or who had the potential to drop out.
SNA, together with educational data mining, has also been leveraged to assess how learner interactions through various communication networks impacted learning as well as performance. For example, Mastoory et al. (2016) focus on the impact of communication and behaviour networks and how they affect a learner’s academic performance. Their study also shows how communication networks play a vital role in predicting a learner’s performance.
Although all these studies have shown how SNA and machine learning have been used individually to analyse and/or predict learner behaviour, more could be done to demonstrate how beneficial it would be to combine both techniques. This may not only help us effectively predict learner academic performance but also potentially give us more insights into what factors influence learner performance. Therefore, this study’s aim was to apply and examine the efficacy of a framework where SNA is applied to visualise and analyse learners’ interactions with virtual resources in the Open University Learning Analytics Dataset (OULAD; Kuzilek et al., 2017), and the insights obtained from it are used to predict learners’ academic performance with the application of machine learning techniques. With the suggested framework, in which SNA and machine learning are combined, we have attempted to explore the factors that may have been integral to learner performance based on VLE behaviour.
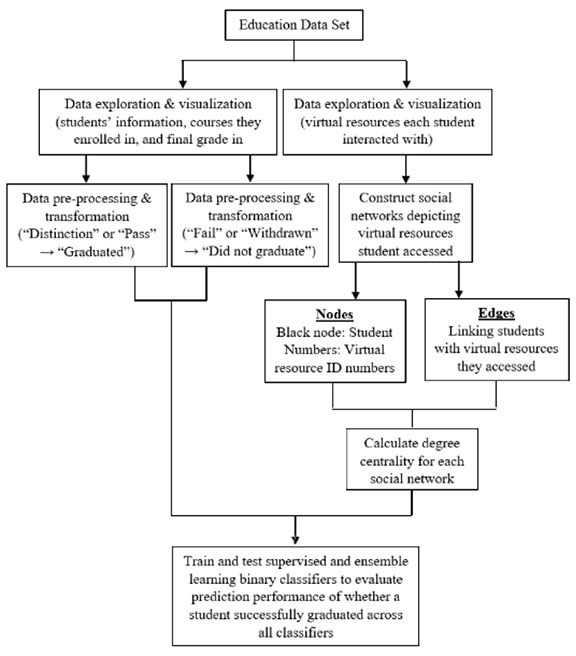
The main research processes that were undertaken in this study are summarised in Figure 1. Data exploration and visualisation were conducted to obtain information about the learners, the courses they enrolled in, and the virtual learning resources they accessed for each course they were enrolled in. Social network graphs were constructed depicting the online behaviour of each learner before computing the centrality values chosen for each node in the graph. Data preprocessing was then conducted to assign the binary labels graduated and did not graduate to each learner based on their final grade (Table 1). Finally, we trained and tested binary classifiers with the data we had prepared using supervised and ensemble learning algorithms to predict whether a learner was able to successfully clear a course. The machine learning technique was used not only to compare the performance across all classifiers but also to gain more insights via the analysis of each classifier’s performance in the prediction task to find out the common behavioural aspects of learners that adversely affected prediction performance across all classifiers.
Figure 1
Main Research Processes
Table 1
Assignment of Class Labels to the Final Result
| Final result | Class label |
| Distinction, pass | Graduated |
| Withdrawn, fail | Did not graduate |
The publicly available anonymised OULAD was used in this study; its structure is illustrated in Figure 2. It primarily contains information about the learners from seven different courses, their activity within the VLE, and the assessments they completed for each course in 2013 and 2014. The data also contain their achieved results for the course. There are two semesters or presentations for each year, which commenced in February and October, and are labelled B and J, respectively. Some courses offered in B may not be offered in J, and vice versa. Details about the data contained in each of the seven records found in the data set are displayed in Figure 3, and Figure 4 presents an overall summary of learner demographics and backgrounds.
Figure 2
Structure of Data Set
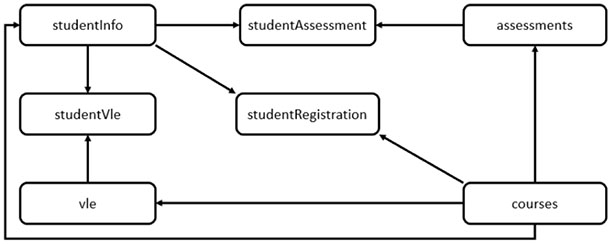
Figure 3
Information in Data Records
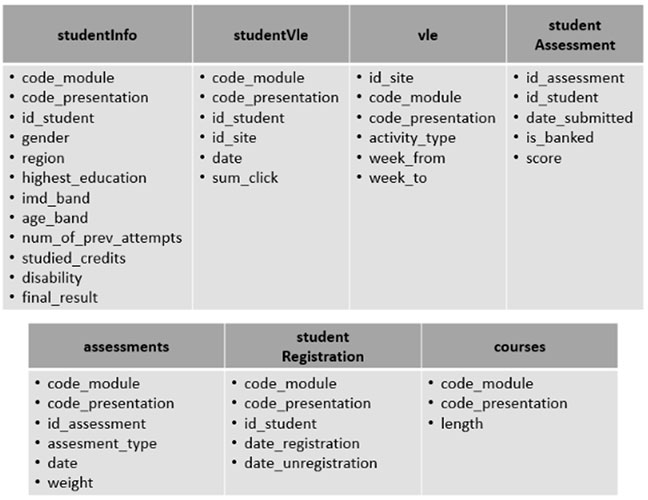
Figure 4
Summary of Learner Demographics and Backgrounds
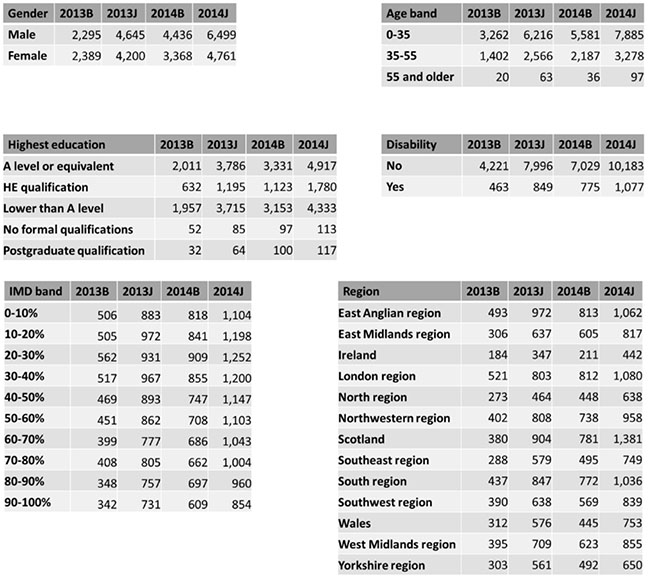
Note. HE = higher education; IMD = indices of multiple deprivation.
Besides identification code, domain, and course length, no further information regarding the structure or contents of the course was provided in the data set. Furthermore, as our study is based on how a learner behaved within a VLE, our analysis of the data set showed that the only behavioural features recorded were the virtual resources a learner accessed and the number of clicks made within that resource on a given date. As the latter was not indicative of how the learner was interacting with the resource, and no data were given about the content of the resource, we did not include the number of clicks as a behavioural feature to avoid interpreting it incorrectly.
Each course in each presentation will have a separate VLE, in which a variety of virtual resources will be made available to supplement learners’ learning and also to assess their understanding of the course material. These resources can be in the form of Hyper Text Markup Language (HTML) pages, Portable Document Format (PDF) files, or some other form of media. A basic summary of the courses, the learners in each course, and virtual resources in the VLE for each course across all presentations are presented in Table 2. The courses were not offered if they had zero learners and resources in a particular presentation.
Table 2
Number of Learners and Virtual Resources per Course (in Each Semester or Presentation)
| Course | Domain | 2013B | 2013J | 2014B | 2014J | ||||
| Learners | Virtual resources | Learners | Virtual resources | Learners | Virtual resources | Learners | Virtual resources | ||
| AAA | Social sciences | 0 | 0 | 378 | 209 | 0 | 0 | 357 | 197 |
| BBB | Social sciences | 1,537 | 315 | 1,870 | 320 | 1,294 | 311 | 1,921 | 206 |
| CCC | STEM | 0 | 0 | 0 | 0 | 1,681 | 180 | 2,302 | 220 |
| DDD | STEM | 1,214 | 408 | 1,768 | 456 | 1,116 | 447 | 1,647 | 361 |
| EEE | STEM | 0 | 0 | 964 | 107 | 624 | 104 | 1,097 | 110 |
| FFF | STEM | 1,510 | 500 | 2,098 | 526 | 1,363 | 475 | 2,121 | 449 |
| GGG | Social sciences | 0 | 0 | 895 | 137 | 773 | 124 | 698 | 106 |
Note. STEM = science, technology, engineering, and mathematics.
Data preprocessing was carried out to ensure the data set had binary labels to learn from and predict before we trained a binary classifier. This was conducted by labelling learners who achieved a distinction or pass the result as graduated and those who got a final result of fail or withdrawn as did not graduate. The virtual resource node’s centrality values were then computed and used to predict learners who did and did not graduate.
Figure 5 illustrates the percentage of graduated and nongraduated learners for four different presentations: 2013B, 2013J, 2014B, and 2014J. More learners were able to graduate in 2013B compared with 2014B, and more learners were able to graduate in 2013J compared to 2014J.
Figure 5
Graduating Versus Nongraduating Learners per Presentation
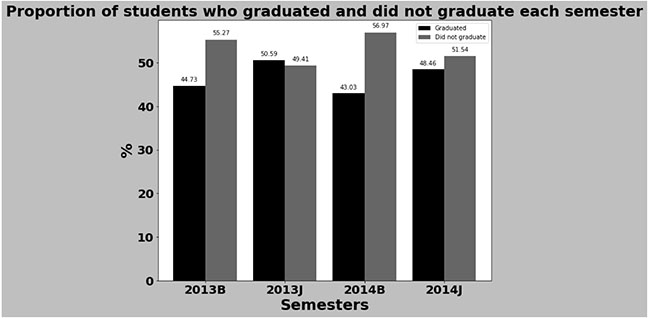
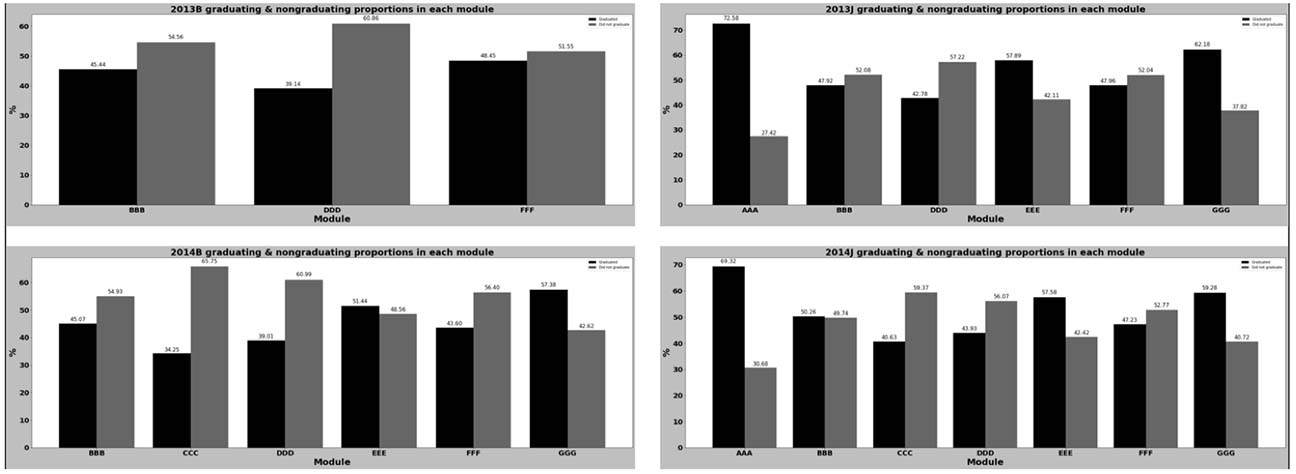
Figure 6 shows a detailed breakdown of the proportion of graduating and nongraduating learners for each course in each semester. Courses BBB, DDD, and FFF had higher numbers of nongraduating learners in both presentations in 2013. The inclusion of the course CCC seemed to cause a spike in the overall number of nongraduating learners; it had the highest proportion of nongraduating learners compared with the other courses in 2014. In both 2013 and 2014, courses AAA, EEE, and GGG had more learners graduating.
Figure 6
Graduating Versus Nongraduating Learners for Each Course in Each Presentation
In this study, SNA was used to analyse learners’ online behaviour via their interactions with virtual resources in the course they were enrolled in. Due to course CCC’s influence on the nongraduating population in both semesters in 2014, and because course GGG had more learners who graduated in these semesters, we chose to focus on predicting the performance of learners enrolled in these courses (CCC and GGG) in 2014 observe whether they would differ in terms of prediction performance.
Each learner has an undirected social network graph that depicts the unique resources a learner accessed for the entirety of a course. A black node is used for the learner while resource identification numbers are used to indicate which virtual resources the learner accessed. The edges in the network represent the learner accessing the virtual resource at least once in the course and are weighted based on the number of times the learner accessed that particular virtual resource for the duration of the course.
The social networks were constructed in this manner as we opted to visualise the learners and virtual resources as entities of the same type, among which there is an exchange of information from both sides. Nevertheless, we could not draw any edges between any two resources in the social networks we had constructed, and we also could not construct a social network dedicated to the resources as no information was provided on whether the resources interacted with each other. Furthermore, we could not construct social networks to visualise and observe these as no records were provided in the data set about interactions between learners or information related to forum discussions.
A summary of the learner population, the number of virtual resources in the course’s VLE for the semester, and data related to the social networks for each course we focused on are presented in Table 3.
Table 3
Summary of Data for Social Networks of Each Learner in Courses CCC and GGG in 2014
| Variable | CCC_2014B | CCC_2014J | GGG_2014B | GGG_2014J |
| Learners | 1,681 | 2,302 | 773 | 698 |
| Virtual resources | 180 | 220 | 124 | 106 |
| Social networks constructed | 1,681 | 2,302 | 773 | 698 |
| Min. number of nodes | 1 | 1 | 1 | 1 |
| Max. number of nodes | 181 | 221 | 125 | 107 |
| Min. number of edges | 0 | 0 | 0 | 0 |
| Max. number of edges | 180 | 220 | 124 | 106 |
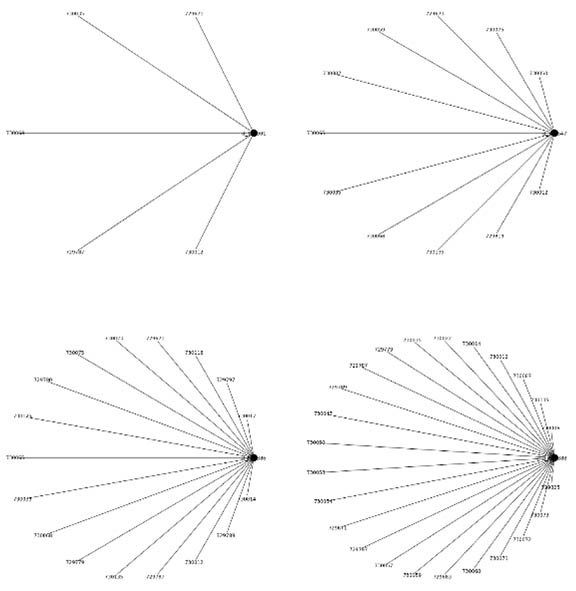
After we constructed the social networks for each learner in courses CCC and GGG, of which some examples are shown in Figure 7, we computed the degree centralities for each network. Golbeck (2013) defines degree centrality as the number of edges a node has or the number of nodes a node is linked to. Degree centrality was employed based on the aim of our study, which was to analyse how a learner’s interaction with virtual resources in a VLE affects their performance.
Figure 7
Samples of Constructed Social Networks Depicting Resources a Learner Interacted With
Based on the computed degree centralities of each network, we observed that all learners had a constant centrality value as they only have edges linking their nodes to the course nodes. Depending on the number of nodes in the social network graph, all virtual resources a learner access will approximately have the same centrality value, as there is only one edge linking each virtual resource node with a learner and no edges between any virtual resource nodes. The overall distribution of the virtual resource degree centrality values for the entire course cohort is shown in Figure 8, and the distributions of the virtual resource degree centrality values for the learners who graduated and did not graduate for courses CCC and GGG are displayed in Figures 9 and 10, respectively.
Figure 8
Distribution of Degree Centrality for Entire Learner Cohort in Courses CCC and GGG in 2014
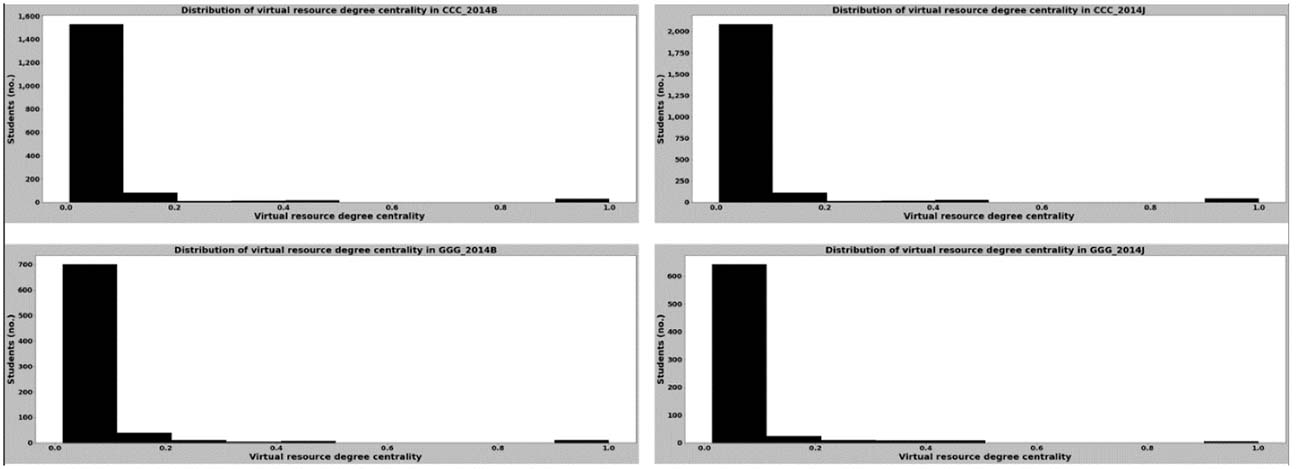
Figure 9
Distribution of Degree Centrality for Graduating and Nongraduating Cohorts in Course CCC in 2014
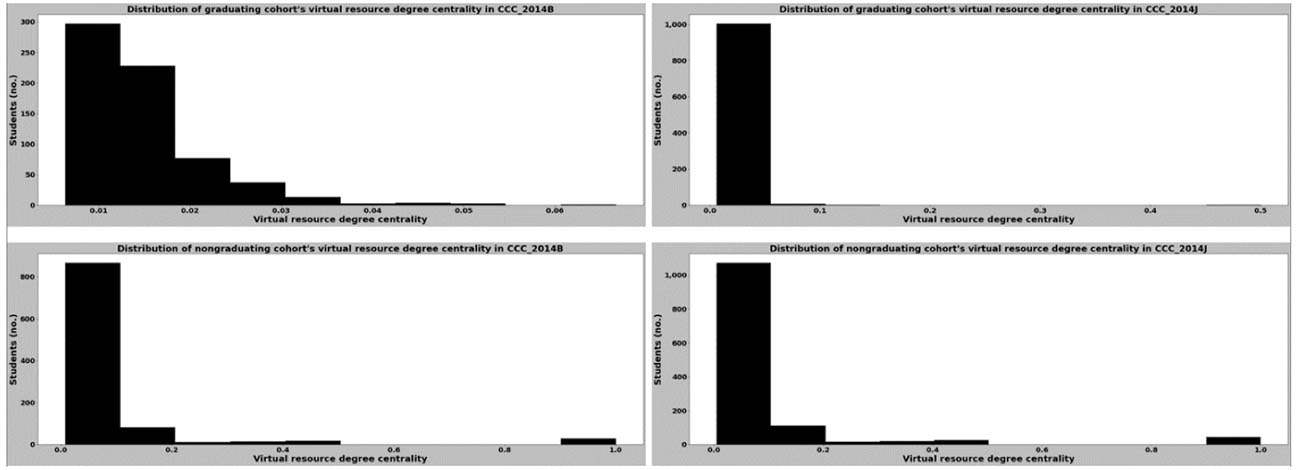
Figure 10
Distribution of Degree Centrality for Graduating and Nongraduating Cohorts in Course GGG in 2014
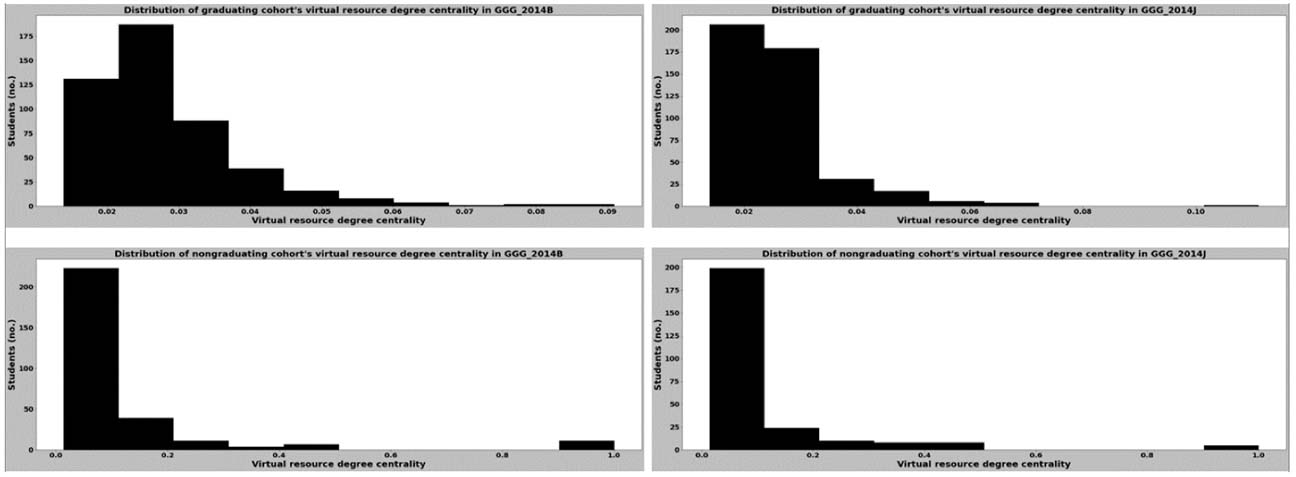
The distributions in Figures 9 and 10 indicate that virtual resource access does not seem to be a key contributor to the differences between the graduating proportions of students in courses CCC and GGG. Furthermore, Figure 8 shows that the distribution of the virtual resource degree centrality values for both courses in both semesters are similar; with the mean degree centrality values ranging between 0.058 and 0.065.
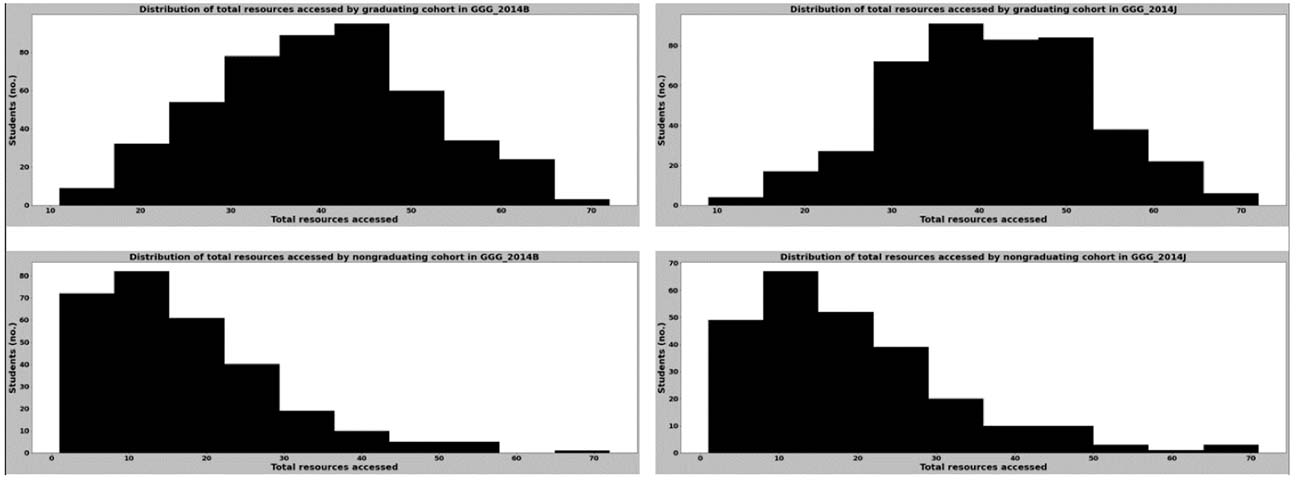
By comparing the range of values in each distribution shown in Figures 9 and 10, we found that the virtual resource degree centrality values for learners who graduated had a narrower range compared with those of learners who did not graduate, regardless of the course they were enrolled in. This could be due to differences in the total virtual resources accessed by the learners in either group for the duration of the courses, which can be observed in the differences between the distributions of the total number of virtual resources accessed (Figures 11, 12).
Figure 11
Distribution of the Total Number of Virtual Resources Accessed for Graduating and Nongraduating Cohorts in Course CCC in 2014
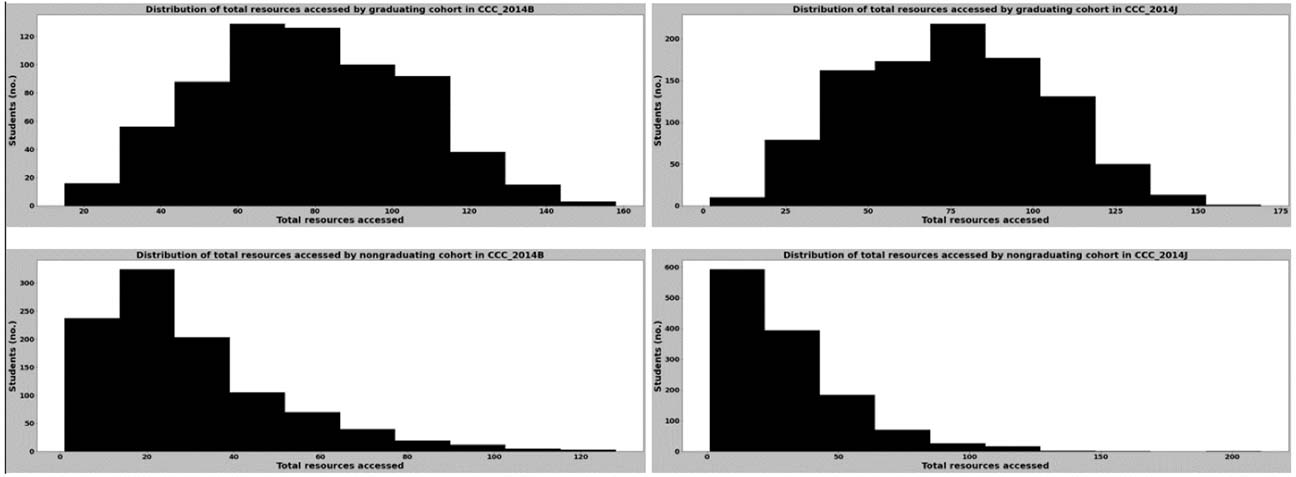
Figure 12
Distribution of the Total Number of Virtual Resources Accessed for Graduating and Nongraduating Cohorts in Course GGG in 2014
As the main focus of this study was the binary classification of learners who did or did not graduate, we trained a variety of binary classifiers that employed either supervised learning or ensemble learning in the scikit-learn Python library. For each course in each presentation, training and test data sets consisting of the degree centrality values along with the labels for the learners’ final performance were used to train and test the binary classifiers.
Table 4 summarises the accuracy obtained with the training and test data sets for each course. The binary classifiers we had trained performed well with the virtual resource degree centrality values as features; the accuracy we obtained with them was primarily at least 80% for both the training and test sets. No disparity existed in accuracy between the supervised learning classifiers and the ensemble learning classifiers. However, the accuracy for the CCC_2014J test set was the poorest (around 70%-72%) for most of the ensemble learning methods.
Table 4
Binary Classifier Accuracy (%)
| Classifiers | CCC_2014B | CCC_2014J | GGG_2014B | GGG_2014J | ||||
| Train | Test | Train | Test | Train | Test | Train | Test | |
| Logistic regression | 83.41 | 84.87 | 80.07 | 80.91 | 84.47 | 81.94 | 84.95 | 82.86 |
| K-nearest neighbours | 84.52 | 77.74 | 80.23 | 80.04 | 83.82 | 83.87 | 86.56 | 80.00 |
| Support vector machines | 83.41 | 85.46 | 80.45 | 80.69 | 85.60 | 83.87 | 86.02 | 82.86 |
| Decision tree | 84.75 | 80.12 | 82.07 | 71.58 | 85.92 | 78.71 | 87.28 | 81.43 |
| Bagging classifier | 83.93 | 80.12 | 81.64 | 70.72 | 85.60 | 84.52 | 86.92 | 81.43 |
| AdaBoost | 84.75 | 81.01 | 81.10 | 70.50 | 85.92 | 84.52 | 87.28 | 82.14 |
| Random forest | 84.75 | 81.60 | 81.91 | 71.37 | 85.92 | 85.81 | 87.28 | 81.43 |
| Voting classifier | 84.67 | 81.01 | 81.75 | 81.34 | 85.60 | 83.23 | 86.92 | 81.43 |
To further analyse which label predictions had impacted the accuracy of the classifiers, we analysed the precision, recall, and F1-score of each classifier for each label in courses CCC and GGG, which are displayed in Tables 5 and 6, respectively. These performance metrics further support the fact that the degree centrality features perform well in predicting a learner’s performance. Nevertheless, most of the classifiers reflected poor recall for learners who graduated from course CCC (63%-75%) and learners who did not graduate from course GGG (60%-71%).
Table 5
Classification Report for Predicting Performance in Course CCC with Virtual Resource Degree Centralities
| Classifier | Label | CCC_2014B | CCC_2014J | ||||
| Precision (%) | Recall (%) | F1-score (%) | Precision (%) | Recall (%) | F1-score (%) | ||
| Logistic regression | Did not graduate | 89.08 | 82.89 | 85.87 | 93.94 | 70.99 | 80.87 |
| Graduated | 80.37 | 87.33 | 83.71 | 71.10 | 93.97 | 80.95 | |
| K-nearest neighbours | Did not graduate | 77.45 | 84.49 | 80.82 | 89.35 | 73.66 | 80.75 |
| Graduated | 78.20 | 69.33 | 73.50 | 71.84 | 88.44 | 79.28 | |
| Support vector machines | Did not graduate | 90.12 | 82.89 | 86.35 | 93.03 | 71.37 | 80.78 |
| Graduated | 80.61 | 88.67 | 84.44 | 71.15 | 92.96 | 80.61 | |
| Decision tree | Did not graduate | 78.04 | 89.30 | 83.29 | 73.82 | 77.48 | 75.61 |
| Graduated | 83.74 | 68.67 | 75.46 | 68.28 | 63.82 | 65.97 | |
| Bagging classifier | Did not graduate | 80.61 | 84.49 | 82.51 | 73.43 | 75.95 | 74.67 |
| Graduated | 79.43 | 74.67 | 76.98 | 66.84 | 63.82 | 65.30 | |
| AdaBoost | Did not graduate | 79.15 | 89.30 | 83.92 | 73.86 | 74.43 | 74.14 |
| Graduated | 84.13 | 70.67 | 76.81 | 65.99 | 65.33 | 65.66 | |
| Random forest | Did not graduate | 80.19 | 88.77 | 84.26 | 74.07 | 76.34 | 75.19 |
| Graduated | 83.85 | 72.67 | 77.86 | 67.54 | 64.82 | 66.15 | |
| Voting classifier | Did not graduate | 80.60 | 86.63 | 83.51 | 91.90 | 73.66 | 81.78 |
| Graduated | 81.62 | 74.00 | 77.62 | 72.51 | 91.46 | 80.89 | |
Table 6
Classification Report for Predicting Performance in Course GGG with Virtual Resource Degree Centralities
| Classifier | Label | GGG_2014B | GGG_2014J | ||||
| Precision (%) | Recall (%) | F1-score (%) | Precision (%) | Recall (%) | F1-score (%) | ||
| Logistic regression | Did not graduate | 100.00 | 60.56 | 75.44 | 97.06 | 58.93 | 73.33 |
| Graduated | 75.00 | 100.00 | 85.71 | 78.30 | 98.81 | 87.37 | |
| K-nearest neighbours | Did not graduate | 97.92 | 66.20 | 78.99 | 85.00 | 60.71 | 70.83 |
| Graduated | 77.57 | 98.81 | 86.91 | 78.00 | 92.86 | 84.78 | |
| Support vector machines | Did not graduate | 97.92 | 66.20 | 78.99 | 94.44 | 60.71 | 73.91 |
| Graduated | 77.57 | 98.81 | 86.91 | 78.85 | 97.62 | 87.23 | |
| Decision tree | Did not graduate | 75.68 | 78.87 | 77.24 | 82.61 | 67.86 | 74.51 |
| Graduated | 81.48 | 78.57 | 80.00 | 80.85 | 90.48 | 85.39 | |
| Bagging classifier | Did not graduate | 92.73 | 71.83 | 80.95 | 85.71 | 64.29 | 73.47 |
| Graduated | 80.00 | 95.24 | 86.96 | 79.59 | 92.86 | 85.71 | |
| AdaBoost | Did not graduate | 92.73 | 71.83 | 80.95 | 86.05 | 66.07 | 74.75 |
| Graduated | 80.00 | 95.24 | 86.96 | 80.41 | 92.86 | 86.19 | |
| Random forest | Did not graduate | 92.98 | 74.65 | 82.81 | 85.71 | 64.29 | 73.47 |
| Graduated | 81.63 | 95.24 | 87.91 | 79.59 | 92.86 | 85.71 | |
| Voting classifier | Did not graduate | 97.87 | 64.79 | 77.97 | 85.71 | 64.29 | 73.47 |
| Graduated | 76.8% | 98.81 | 86.46 | 79.59 | 92.86 | 85.71 | |
To identify what contributed to poor recall for the groups in courses CCC and GGG, we compared the distribution of the virtual resource degree centrality values of the wrongly classified learners in each group and also the distributions of the total number of virtual resources these learners accessed (Figures 13-16). By comparing these distributions together with those in Figures 9-12, we found that most of the learners who were misclassified had virtual resource degree centrality values that were clustered around a particular range for both the graduating and nongraduating cohorts. Furthermore, the findings revealed that some learners who were wrongly classified had virtual resource degree centrality values that rarely occurred. All clusters and rare values of centrality values we observed are shown in Table 7.
Figure 13
Distribution of Virtual Resource Degree Centralities for Wrongly Classified Learners in Course CCC in 2014
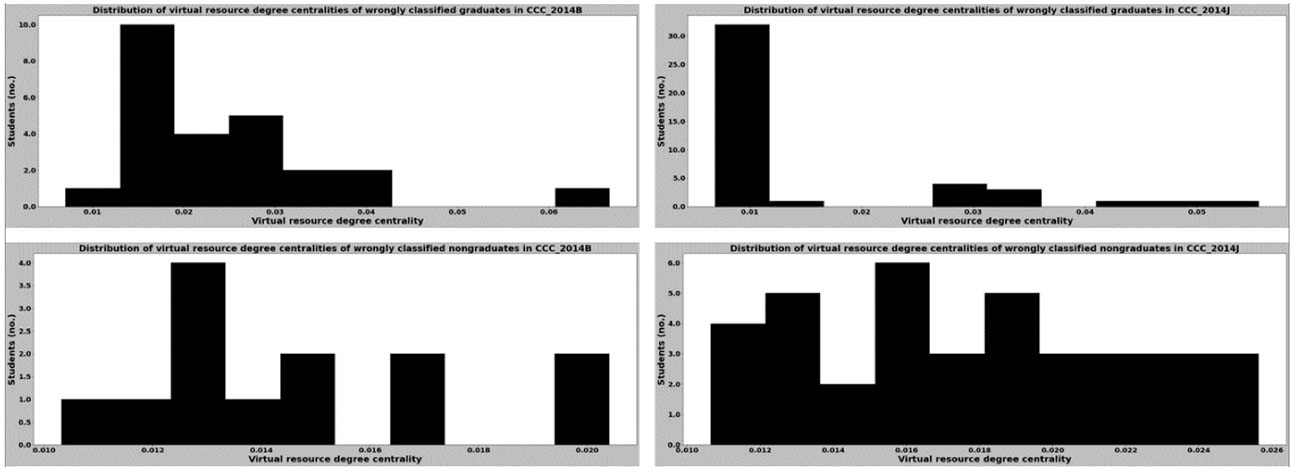
Figure 14
Distribution of Virtual Resource Degree Centralities for Wrongly Classified Learners in Course GGG in 2014
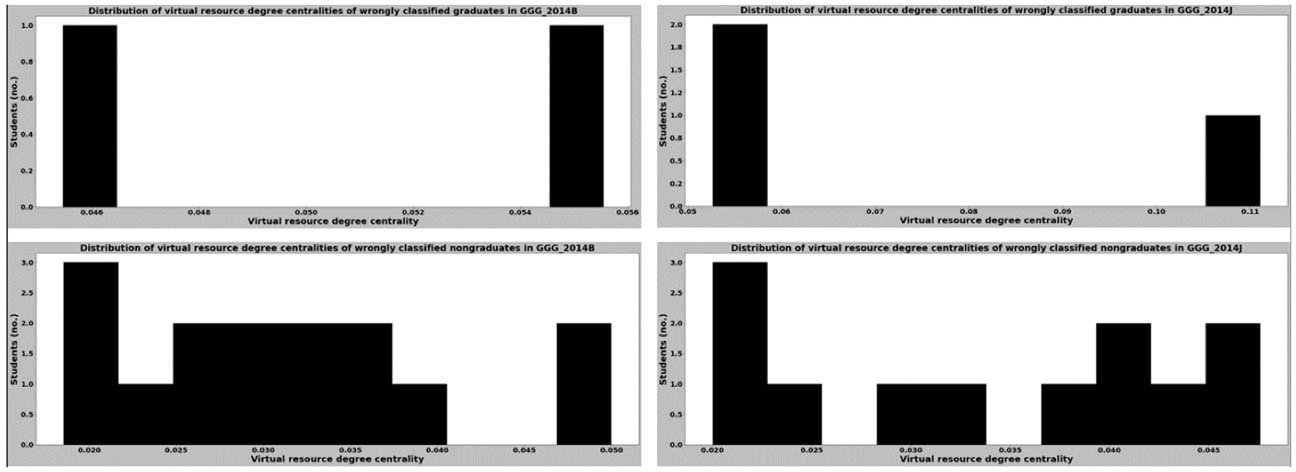
Figure 15
Distribution of the Total Number of Virtual Resources Accessed for Wrongly Classified Learners in Course CCC in 2014
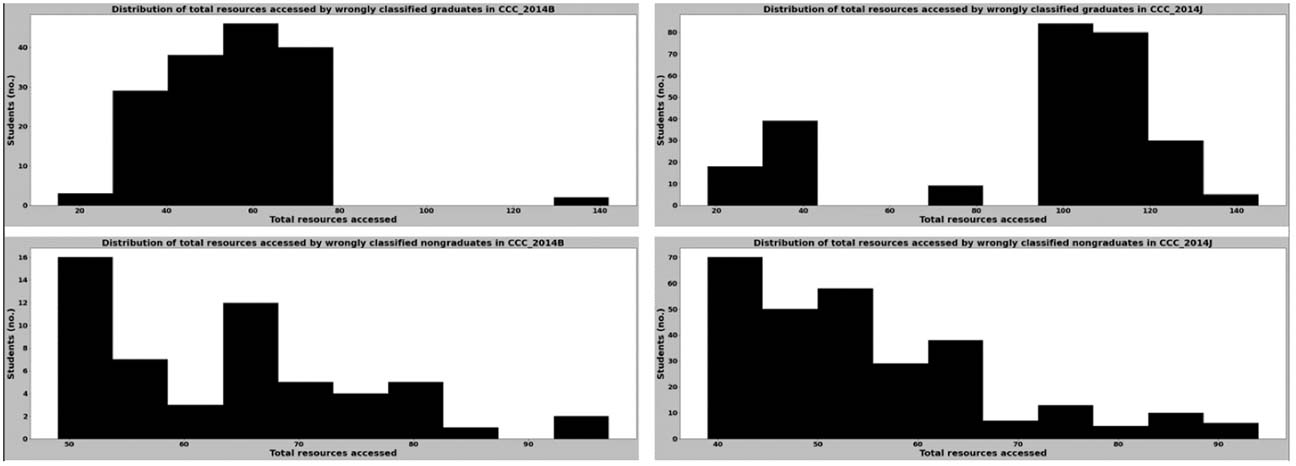
Figure 16
Distribution of the Total Number of Virtual Resources Accessed for Wrongly Classified Learners in Course GGG in 2014
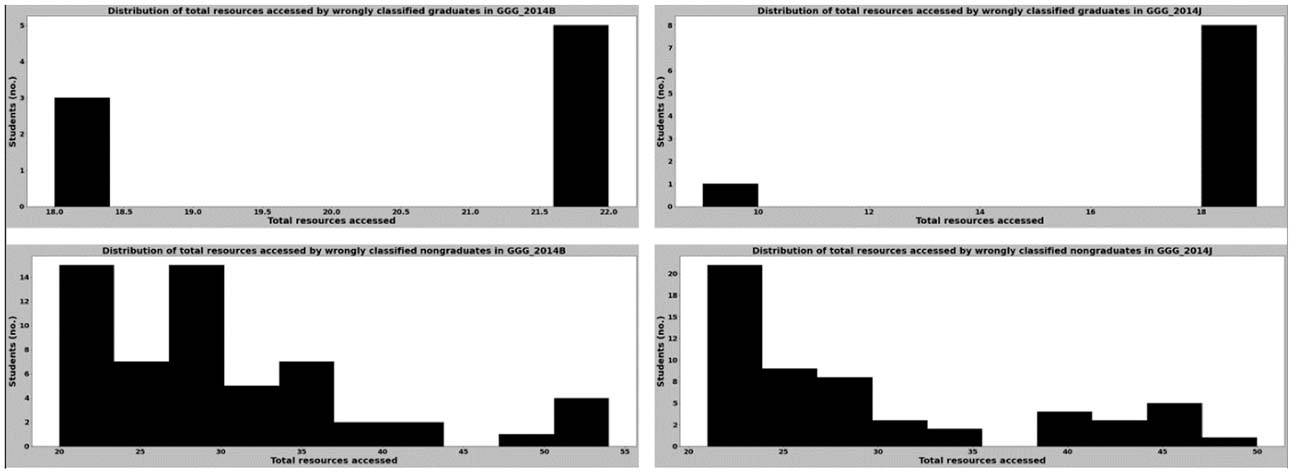
Table 7
Clusters and Rare Values Observed in Wrongly Classified Data
| Variable | CCC_2014B | CCC_2014J | GGG_2014B | GGG_2014J | ||||
| Clusters | Rare values | Clusters | Rare values | Clusters | Rare values | Clusters | Rare values | |
| Virtual resource degree centrality | 0.01-0.040 | 0.007, 0.067 | 0.01-0.026 | < 0.008, > 0.04 | 0.018-0.05 | 0.056 | 0.02-0.05 | 0.05, 0.1 |
| Total number of virtual resources accessed | 24-100 | 15, 142 | 30-100 | < 30, > 125 | 20-55 | 18 | 20-50 | 9, 18, 19 |
The chosen binary classifiers on the virtual resource degree centrality values are trained and tested, and we obtained an accuracy of 80%-85% on the test set of both courses across most of the binary classifiers. The overall level of performance we observed appears to be promising and encouraging.
Our analysis of the classifiers’ performance shows that the accuracy for the test set of CCC_2014 was poorest for most of the ensemble learning methods compared with the other course cohorts, and when the metrics for each classifier were compared and analysed, most of the binary classifiers performed rather poorly in recall for learners who graduated from course CCC and learners who did not graduate from course GGG. Our initial assessment was that the classifiers would have been unable to classify some learners in the graduating and nongraduating cohorts because of inconsistencies in their virtual resource degree centralities.
We derived insight from analysing the distribution of the virtual resource degree centralities together with the distribution of the total resources accessed by learners who were wrongly classified. The binary classifiers we employed in this study were not able to separate clusters due to common behaviours among the graduating and nongraduating cohorts into the different groups of learners they consisted of during the training of each classifier, and there were very few instances of the rare centrality values to be trained upon. Therefore, the binary classifiers, regardless of whether they were based on supervised or ensemble learning, faced difficulties in classifying learners who had such virtual resource degree centrality values.
A limitation of our study is that the machine learning classifiers were unable to correctly predict whether some learners would or would not graduate due to anomalies in their online behaviour. If more data were available related to how a learner had interacted with a virtual resource and/or the amount of time spent with/on it, as well as more data indicative of the actual content in a resource, we would have been able to incorporate them into the construction of the social networks for a more accurate depiction of a learner’s online behaviour, and the classifiers could have distinguished and predicted learners who graduated from those who did not. Such data could also provide more insights into factors affecting learners.
In this study, we attempted to predict learners’ academic performance based on their interactions with the resources provided in a course’s virtual learning environment. SNA was performed to obtain the degree centrality of the virtual resources that learners interacted with. Using the virtual resource degree centrality value for each learner, supervised learning and ensemble learning binary classifiers were leveraged to predict whether a learner would graduate from a course.
The overall accuracy we obtained with the chosen binary classifiers on degree centrality values is promising. The performance metrics for all classifiers revealed that the virtual resource degree centrality value is a viable feature to predict learner performance, which further implies that learners’ interactions with virtual resources have a significant effect on their performance. This was true for both the courses we focused on in this study despite the differences in the proportions of graduating and nongraduating cohorts.
Instructors and course facilitators may make use of our framework to monitor a learner’s learning based on their interactions with virtual resources at any point in the course, especially the SNA component, to help them visualise and understand a learner’s online behaviour. The social network depicting the online behaviour of each learner is straightforward to understand, and instructors will be able to detect learners who are falling behind based on the size of their social network compared with other learners. This, coupled with data related to the learner’s session activity with each virtual resource they interacted with, would greatly assist in promptly providing early intervention and support to learners who are performing below average. With more comprehensive data about resources and how learners interacted with them, the perspective of social networks may be shifted to better understand how learners are interacting with each resource and whether a learner is facing any difficulty with a resource based on their behaviour with it (e.g., less or more time spent on a resource compared with other learners, unusual interaction with a resource).
In addition, by leveraging machine learning to predict learner performance, instructors and course facilitators will be able to analyse and gain in-depth insights about common learner behavioural traits or anomalous behaviour in the past and how these affected learners’ performance. At-risk learners could be identified early, and in-time intervention provided. Eventually, the success of a course could be improved, and subsequently, dropout risk could be reduced.
Our study primarily focused on implementing a framework for visualising the online behaviour of learners in courses that heavily rely on virtual environments to disseminate knowledge and assess the understanding of each learner. We also demonstrated that data derived from analysing learners’ online behaviour can be used to predict whether learners can successfully complete a course. With the performance scores we obtained with our framework, along with the insights we gained into the gaps in our predictive models, we have gained a good idea of what works and what can be done to improve the predictive models.
In the future, we seek to improve the prediction models’ performance by using a range of final result values instead of categorical labels to overcome the clustering in the virtual resource node centrality values among graduating and nongraduating learners. Further work may also include examining which virtual resources contribute most to a learner’s performance. Finally, we aim to apply the proposed framework to other education-related data sets with more data on how students interacted with each other to better understand how this interaction affects their learning.
Agudo-Peregrina, Á. F., Hernández-García, Á., & Iglesias-Pradas, S. (2012, October). Predicting academic performance with learning analytics in virtual learning environments: A comparative study of three interaction classifications. In F. José García, L. Vicent, M. Ribó, A. Climent, J. L. Sierra, & A. Sarasa (Eds.), 2012 International Symposium on Computers in Education (SIIE) (pp. 1-6). Institute of Electrical and Electronics Engineers. https://ieeexplore.ieee.org/document/6403184
Al-Azawei, A., & Al-Masoudy, M. (2020). Predicting learners’ performance in virtual learning environment (VLE) based on demographic, behavioral and engagement antecedents. International Journal of Emerging Technologies in Learning (IJET), 15 (9), 60-75. https://doi.org/10.3991/ijet.v15i09.12691
Albreiki, B., Zaki, N., & Alashwal, H. (2021). A systematic literature review of student’ performance prediction using machine learning techniques. Education Sciences, 11(9), 552. https://doi.org/10.3390/educsci11090552
Chung, K. S. K., & Paredes, W. C. (2015). Towards a social networks model for online learning & performance. Educational Technology & Society, 18(3), 240-253. http://www.jstor.org/stable/jeductechsoci.18.3.240
de Barba, P. G., Kennedy, G. E., & Ainley, M. D. (2016). The role of students’ motivation and participation in predicting performance in a MOOC. Journal of Computer Assisted Learning, 32(3), 218-231. https://doi.org/10.1111/jcal.12130
Dragulescu, B., Bucos, M., & Vasiu, R. (2015). Social network analysis on educational data set in RDF format. Journal of Computing and Information Technology, 23(3), 269-281. https://doi.org/10.2498/cit.1002645
Golbeck, J. (2013). Network structure and measures. Analyzing the social Web (pp. 25-44). Morgan Kaufmann. https://doi.org/10.1016/C2012-0-00171-8
Grunspan, D. Z., Wiggins, B. L., & Goodreau, S. M. (2014). Understanding classrooms through social network analysis: A primer for social network analysis in education research. CBE—Life Sciences Education, 13(2), 167-178. https://doi.org/10.1187/cbe.13-08-0162
Khor, E.T. & Looi, C.K. (2019) A learning analytics approach to model and predict learners’ success in digital learning. In Y. W. Chew, K. M. Chan, and A. Alphonso (Eds.), Personalised Learning. Diverse Goals. One Heart. ASCILITE 2019 Singapore (pp. 476-480). https://repository.nie.edu.sg/bitstream/10497/22077/1/ASCILITE-2019-476.pdf
Koza, J. R., Bennett, F. H., Andre, D., & Keane, M. A. (1996). Automated design of both the topology and sizing of analog electrical circuits using genetic programming. In J. S. Gero & F. Sudweeks (Eds.), Artificial Intelligence in Design ’96 (pp. 151-170). Springer, Dordrecht. https://doi.org/10.1007/978-94-009-0279-4_9
Kuzilek, J., Hlosta, M., & Zdrahal, Z. (2017). Open University learning analytics dataset. Scientific Data, 4(1), Article 170171. https://doi.org/10.1038/sdata.2017.171
Mastoory, Y., Harandi, S. R., & Abdolvand, N. (2016). The effects of communication networks on students’ academic performance: The synthetic approach of social network analysis and data mining for education. International Journal on Integrating Technology in Education, 5(4), 23-34. https://doi.org/10.5121/ijite.2016.5403
Mitchell, T. M. (1997). Machine learning. McGraw-Hill.
Mariame, O., Khouljian, S. & Kerbeb, M.L. (2021). Feature engineering, mining for predicting student success based on interaction with the virtual learning environment using artificial neural network. Annals of the Romanian Society for Cell Biology, 25(6), 12734-12746. https://www.annalsofrscb.ro/index.php/journal/article/view/8002/5907
Otte, E., & Rousseau, R. (2002). Social network analysis: A powerful strategy, also for the information sciences. Journal of Information Science, 28(6), 441-453. https://doi.org/10.1177/016555150202800601
Rabbany, R., Takaffoli, M., & Zaiane, O. R. (2012). Social network analysis and mining to support the assessment of on-line student participation. ACM SIGKDD Explorations Newsletter, 13(2), 20-29. https://doi.org/10.1145/2207243.2207247
Rakic, S., Pavlovic, M., Softic, S., Lalic, B., & Marjanovic, U. (2019, November). An evaluation of student performance at e-learning platform. In 2019 17th International Conference on Emerging eLearning Technologies and Applications (ICETA) (pp. 681-686). Institute of Electrical and Electronics Engineers. https://doi.org/10.1109/ICETA48886.2019.9040066
Rakic, S., Softic, S., Vilkas, M., Lalic, B., & Marjanovic, U. (2018, November). Key indicators for student performance at the e-learning platform: An SNA approach. In 2018 16th International Conference on Emerging eLearning Technologies and Applications (ICETA) (pp. 463-468). Institute of Electrical and Electronics Engineers. https://doi.org/10.1109/ICETA.2018.8572236
Rakic, S., Tasic, N., Marjanovic, U., Softic, S., Lüftenegger, E., & Turcin, I. (2020). Student performance on an e-learning platform: Mixed method approach. International Journal of Emerging Technologies in Learning (iJET), 15(2), 187-203. https://doi.org/10.3991/ijet.v15i02.11646
Rivas, A., Gonzalez-Briones, A., Hernandez, G., Prieto, J., & Chamoso, P. (2021). Artificial neural network analysis of the academic performance of students in virtual learning environments. Neurocomputing, 423, 713-720. https://doi.org/10.1016/j.neucom.2020.02.125
Saqr, M., Fors, U., & Nouri, J. (2018). Using social network analysis to understand online problem-based learning and predict performance. PloS ONE, 13(9), Article e0203590. https://doi.org/10.1371/journal.pone.0203590
Sekeroglu, B., Dimililer, K., & Tuncal, K. (2019, March). Student performance prediction and classification using machine learning algorithms. In ICEIT 2019: Proceedings of the 2019 8th International Conference on Educational and Information Technology (pp. 7-11). Association for Computing Machinery. https://doi.org/10.1145/3318396.3318419
Waheed, H., Hassan, S. U., Aljohani, N. R., Hardman, J., Alelyani, S., & Nawaz, R. (2020). Predicting academic performance of students from VLE big data using deep learning models. Computers in Human Behavior, 104, Article 106189. https://doi.org/10.1016/j.chb.2019.106189
Wolff, A., Zdrahal, Z., Nikolov, A., & Pantucek, M. (2013, April). Improving retention: Predicting at-risk students by analysing clicking behaviour in a virtual learning environment. In D. Suthers, K. Verbert, E. Duval, & X. Ochoa (Eds.), LAK ’13: Proceedings of the Third International Conference on Learning Analytics and Knowledge (pp. 145-149). Association for Computing Machinery. https://doi.org/10.1145/2460296.2460324

A Learning Analytics Approach Using Social Network Analysis and Binary Classifiers on Virtual Resource Interactions for Learner Performance Prediction by Ean Teng Khor and Darshan Dave is licensed under a Creative Commons Attribution 4.0 International License.