Volume 24, Number 4
Denizer Yıldırım1, Hale Ilgaz1, Alper Bayazıt2, and Gökhan Akçapınar3
1Faculty of Open and Distance Education, Ankara University; 2Department of Medical Education and Informatics, Ankara University; 3Department of Computer Education and Instructional Technology, Hacettepe University
One of the biggest challenges for online learning is upholding academic integrity in online assessments. In particular, institutions and faculties attach importance to exam security and academic dishonesty in the online learning process. The aim of this study was to compare the test-taking behaviors and academic achievements of students in proctored and unproctored online exam environments. The log records of students in proctored and unproctored online exam environments were compared using visualization and log analysis methods. The results showed that while a significant difference was found between time spent on the first question on the exam, total time spent on the exam, and the mean and median times spent on each question, there was no significant difference between the exam scores of students in proctored and unproctored groups. In other words, it has been observed that reliable exams can be conducted without the need for proctoring through an appropriate assessment design (e.g., using multiple low-stake formative exams instead of a single high-stake summative exam). The results will guide instructors in designing assessments for their online courses. It is also expected to help researchers in how exam logs can be analyzed and in extracting insights regarding students' exam-taking behaviors from the logs.
Keywords: test-taking behaviors, proctored exam, unproctored exam, formative assessment
Although online learning has been widely used, during the pandemic, many people who had never used this method experienced online learning in their educational lives for the first time. In addition to the many advantages of the widespread use of online learning, such as access, usefulness, and flexibility, its primary problems have been identified as participation, academic dishonesty, and access to digital devices and the Internet (Joshi et al., 2021; Lee & Fanguy, 2022). Effective course design is necessary for effective online learning, and the design of assessment and evaluation activities—one of the five main elements of the design process, which also includes an overview, content presentation, interaction and communication, and learner support—is very important (Martin et al., 2021). During the assessment design process, formative and summative assessment approaches can be used together or separately. Although both methods have their advantages and disadvantages, the assessment should be learning-oriented and support the learning process (Baleni, 2015; Bin Mubayrik, 2020). Student monitoring, improving learning, and performance increment are the fundamental dimensions of the assessment process (Fernandes et al., 2012; Gikandi et al., 2011). The assessment design process must be integrated into the instructional design process to ensure the students’ well-being, as well as for the smooth and successful continuation of the overall process (Slack & Priestley, 2022).
It has been determined that the most challenging issues in online exams are cheating and dishonesty (Alessio et al., 2018; Chirumamilla et al., 2020; Singh & de Villiers, 2017; Vlachopoulos, 2016). Proctoring is one of the most used methods to prevent academic dishonesty. However, conducting face-to-face proctored exams in distance education is not always feasible. Online proctoring systems are also costly. Therefore, alternative methods are needed. Changing the assessment design can be an effective solution. When the assessment design is only summative, the main concern is to focus on problems such as cheating and dishonesty. However, when the assessment process includes formative assessment activities, students’ dishonest behaviors may change. Therefore, this study aimed to compare the academic achievements and test-taking behaviors of students in proctored and unproctored tests within a course in which formative assessment was applied. The significance of this study is that it focused on students’ actual system usage logs, as opposed to previous studies that focused on self-reported data (Chirumamilla et al., 2020; Snekalatha et al., 2021; Yazici et al., 2023).
The research questions for this study were as follows:
Although they are defined as separate assessment methods, summative and formative assessments do not differ sharply from each other, are in a relationship, and are effective when integrated into a design in line with the learning and instructional goals and objectives (Arnold, 2016; Gikandi et al., 2011). Summative assessment consists of assessment activities at the end of the course, while the formative assessment process continues for the whole semester by giving regular feedback and combining several assessment tools (Arnold, 2016).
The use of effective methods in designing the assessment process, especially in online learning environments, is important for reducing cheating and dishonesty (Oosterhof et al., 2008). Various precautions may be taken to prevent cheating behavior in online learning environments. The most commonly used techniques are proctoring software (Lee & Fanguy, 2022; Nigam et al., 2021), biometric controls (Noorbehbahani et al., 2022; Traoré et al., 2017; Vegendla & Sindre, 2019), shuffling questions and choices (Tripathi et al., 2022), random drawing (Goedl & Malla, 2020; Thelwall, 2000), and sequencing (Chirumamilla et al., 2020).
Proctoring systems are artificial intelligence (AI)-based or human-based. In human-based online proctored systems, webcams and microphones are the main tools, but AI-based proctored systems consist of multiple cameras, full system controls, and recordings. In much research focusing on the use of online proctoring software, it has been determined that there is no significant difference in terms of the academic achievement, anxiety, and test-taking behaviors of students when compared to environments in which such software is not used (Rios & Liu, 2017; Stowell & Bennett, 2010). On the other hand, there have been studies that contradict these findings. The flexible conditions of proctored exams, including having the learning materials at hand and collaborating with peers, have resulted in higher exam scores and longer exam completion times when compared with unproctored environments (Alessio et al., 2018; Daffin & Jones, 2018; Goedl & Malla, 2020). In addition to academic dishonesty issues, most of these online proctoring software programs have used biometric data, which brings with it some ethical problems. Security and privacy issues in terms of data protection and usage are the main concerns when these tools have been used (Balash et al., 2021; Draaijer et al., 2018).
It is noteworthy that the current literature has mostly focused on learners’ and teachers’ perceptions of online exams (Chirumamilla et al., 2020; Snekalatha et al., 2021; Yazici et al., 2023). These studies compared (a) how online exams and paper-based exams are perceived in terms of different cheating practices (Chirumamilla et al., 2020); (b) how online tests are perceived in terms of reliability, usefulness, and practical challenges (Snekalatha et al., 2021); and (c) the cheating-related behaviors reported by students themselves and those perceived by academicians (Yazici et al., 2023). These studies have provided some insights regarding current issues, but due to reliance on self-report data, it is controversial to what extent they reflect the real situation. The current literature has shown that there is an inconsistency between the self-report data and the system logs (e.g., Cantabella et al., 2018; Soffer et al., 2017). Besides, it does not seem possible to explore the potential of online learning or assessment systems with self-report data. For this reason, it is important to examine students’ test-taking behaviors through their actual interaction logs.
Students’ behaviors as they use learning systems have provided a considerable amount of information about their cheating attempt, activity level over time and engagement with course materials (Alexandron et al., 2019) and their interaction with the content (Balderas & Caballero-Hernández, 2021; Dominguez et al., 2021; Jaramillo-Morillo et al., 2020; Pelanek, 2021; Trezise et al., 2019). In their study, Trezise et al. (2019) used keystroke logs and clickstream data to prevent contract cheating in a writing task. They analyzed the patterns of writing (including pause, delete, and revision activities) for free-writing, general transcription, and self-transcription tasks. Their findings showed that the writing patterns were differentiated for free writing when compared to the other two writing tasks. Alexandron et al. (2022) used their algorithms—which employ clickstream data such as video events (e.g., play, pause), responses to assessment items, and navigation between course pages—for a massive open online course competency exam model. They found that this exam model reduced cheating in this formative assessment design.
Learning management systems (LMS) keep all student and instructor transactions on the system in their own databases. These logs can also be used as part of the assessment process. The disclosure of students’ test-taking behavior facilitates the identification of their trial-and-error strategies, detects cheating (Man et al., 2018), and provides prompt feedback to support their learning (Hui, 2023). As emphasized in the literature, it is expected that cheating behavior will occur less in an online course that includes assessment activities prepared with an appropriate design. Accordingly, in this study, student behaviors in a course designed based on formative assessment approach were analyzed by examining the system logs.
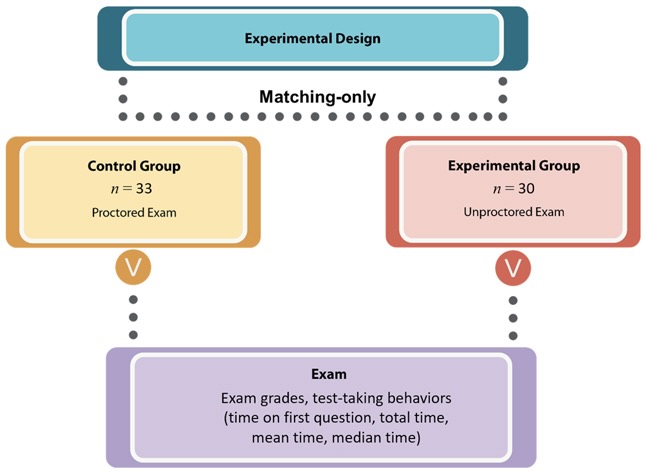
This research was conducted by way of a quasi-experimental design with the matching-only posttest-only control group. A quasi-experimental design is applied in cases in which the sample in the selected population cannot be randomly selected (Fraenkel et al., 2012).
While the control group took the exam online with face-to-face proctoring in a laboratory environment, the experimental group had the flexibility to take the exam from anywhere—everyone was able to access the exam from their own device, and there was no proctoring mechanism. The experiment considered that the students had various levels and quality of Internet access. Due to the nature of exam applications in online environments, this situation can never be controlled (Figure 1).
Experimental and control groups were matched based on a prior knowledge test. There was no significant difference between the two groups (M Control = 31.76; SD Control = 13.15; M Experiment = 32.94; SD Experiment = 13.07; F = .078; p = .781).
Figure 1
Experimental Design
The study group consisted of first-year students enrolled in different undergraduate departments of the faculty of educational sciences at a state university. Through an online survey, both an integrity endorsement and permission to use log data were obtained from the students. A total of 63 students participated in the study.
The experiment was carried out during the implementation of the fourth quiz during the fifth week. The course unit was titled Word Processing Programs. This quiz was chosen because students had to gain experience in previous quizzes to minimize problems using the system.
This study was conducted in the Information Technologies course and included topics such as computational thinking, problem-solving concepts and approaches, basic concepts of software, and office programs. The course instructor was an experienced university instructor. The syllabus of the course was introduced to the students at the beginning of the semester. The course was conducted face-to-face for nine weeks and online for five weeks (the course alternated in a repeating pattern of two weeks face-to-face followed by one week online). Moodle LMS was used in the online learning process. In the first week, the students were informed about how the course would be taught and the assessment criteria. In Moodle, students had access to topic videos (n = 60; average 6 minutes), PDFs (n = 7), and external resources (n = 6) every week. The students completed two discussion activities in the first week, as well as four quizzes and two peer assessment activities in the other weeks. Each of the assessment activities (i.e., quiz, peer assessment, and exams) was weighted to calculate the students’ learning performance. Each student’s end-of-term grade was calculated based on the scores of four quizzes (each quiz 10%; total 40%), a peer assessment activity (10%), and a face-to-face proctored final exam (50%).
Moodle LMS provided a range of options regarding exam settings. In this study, the same settings were used for both the control and experimental groups. Students were allowed to take the exam only once and within the specified time period. The exam duration was planned as 1.5 minutes per question and set to a total of 30 minutes. The 20 questions were presented in random order for each student, and the answer choices were also shuffled. Students were not allowed to navigate freely between questions.
Three data sources were used: (a) prior knowledge test, (b) quiz scores, and (c) students’ exam logs from the Moodle database. Data on students’ activities during the exam were recorded in different tables in the Moodle database (Table 1).
Table 1
Moodle Database Used for Data Analysis
| Moodle table | Children table | Parent table | Number of columns | Comments |
| quiz_attempts | - | Quiz user | 15 | Stores users’ attempts at quizzes |
| logstore_standard_log | - | Context user course | 21 | Standard log table |
The data from the quiz_attempts and logstore_standard_log tables were used to analyze students’ quiz-taking behaviors. The data preprocessing was carried out automatically with the help of a tool the researchers developed. The main function of this tool was to automatically process the log records by converting them into meaningful features. In the logstore_standard_log table (Table 2) in which all the interactions of the students in the Moodle LMS were recorded, the students’ quiz logs were retrieved in relation to the attempt ID. In the analyzed exams, sequential navigation ensured that students could not return to a question that they had previously answered or left blank. There were four actions associated with the exam: (a) start the exam, (b) view questions, (c) submit the exam after viewing all the questions, and (d) review the answers. The target field indicated which Moodle component the action was related to. For example, viewing each question was an attempt. The time of each action was written in the time created field as Unix epoch time (Epoc Converter, n.d.). So, as illustrated in Table 2, the difference between the time created value between any two rows represented the time a student spent on a question. The records in the logstore_standard_log table for each student were taken, and the calculations for the features detailed in the Feature Extraction section were made. In the obtained analysis file, each student was in a row, while the columns included data about that student’s features.
Table 2
Sample Exam Log for a Student
| İd | action | target | time created |
| 27734600 | started | attempt | 1637667708 |
| 27734601 | viewed | attempt | 1637667708 |
| 27734706 | viewed | attempt | 1637667721 |
| 27735149 | viewed | attempt | 1637667798 |
| 27736528 | viewed | attempt | 1637668011 |
| 27737115 | viewed | attempt | 1637668089 |
| 27737718 | viewed | attempt | 1637668177 |
| 27738176 | viewed | attempt | 1637668235 |
| 27738704 | viewed | attempt | 1637668302 |
| 27738879 | viewed | attempt | 1637668328 |
| 27738979 | viewed | attempt | 1637668343 |
| 27739283 | viewed | attempt | 1637668380 |
| 27739445 | viewed | attempt | 1637668396 |
| 27739688 | viewed | attempt | 1637668419 |
| 27739831 | viewed | attempt | 1637668436 |
| 27740402 | viewed | attempt | 1637668513 |
| 27740644 | viewed | attempt | 1637668545 |
| 27740799 | viewed | attempt | 1637668568 |
| 27741041 | viewed | attempt | 1637668598 |
| 27742131 | viewed | attempt | 1637668718 |
| 27742278 | viewed | attempt | 1637668737 |
| 27742620 | viewed | attempt_summary | 1637668770 |
| 27742675 | submitted | attempt | 1637668775 |
| 27742680 | reviewed | attempt | 1637668776 |
While determining the features, the students’ exam logs were analyzed, and attributes were selected to reflect students’ exam-taking behaviors. Typical test-taking behavior includes starting the exam on time, and completing the exam by progressing regularly (i.e., the average time spent on each question is similar). Behaviors such as starting the exam late, spending more time on the first question than the others, or answering most of the questions in a noticeably short time are unusual. For this reason, time spent on the first question, total time spent on the exam, average time spent on each question, and median time spent on each question were selected as features. The extracted features and their descriptions are presented in Table 3.
Table 3
Features Related to Students’ Test-Taking Behaviors
| Feature | Description |
| Time(s) on first question | Time spent on the first question on the exam |
| Total time(s) | Total time spent on the exam |
| Mean time(s) | Mean time spent on each question |
| Median time(s) | Median time spent on each question |
With help from a tool developed by the researcers, the data related to these features were extracted automatically for each student in the experimental and control groups and recorded in the file to be used for further analysis. In addition to these features, the students’ exam scores and prior knowledge scores were added to the dataset to test the equivalence of prior knowledge and exam performances.
Visualization and statistical methods were used in the data analysis. Data visualization methods were used to answer the first research question. The Mann-Whitney U test was used to determine whether there was a difference between the experimental and control groups in terms of exam scores and test-taking behavior variables within the scope of the second and third research questions. R software and the ggplot2 library were used to visualize the test-taking behaviors of students in proctored and unproctored environments. Statistical analyses were performed using the SPSS program.
The results are organized by each of the three research questions.
To understand whether there was a difference between the behavior patterns of the students in the proctored and unproctored exams, the data were visually examined. Figure 3 shows students’ question transition patterns in proctored and unproctored exams. The X axis represents the time in minutes, while the Y axis represents each individual student. Each horizontal line on the graph represents the student’s test-taking behavior. While the dots point to the question the students were on at that moment, the colors vary according to the time. For example, the orange color indicates the first minutes of the exam, while the pink color indicates the last minutes of the exam. Each dot points to a different question (the leftmost dot is the first question, the second question is to its right, the third question is to its right, and so on). A short distance between two points indicates that the student made a quick transition from one question to the next—that is, they spent little time on the question. On the other hand, a long distance between two points indicates that the student spent a long time on that question. The times on the X-axis are aligned so that the two graphs are comparable. In other words, the start time of the exam was zero minutes.
Figure 3
Students’ Test-Taking Behaviors in Proctored (Panel a) and Unproctored (Panel b) Exams
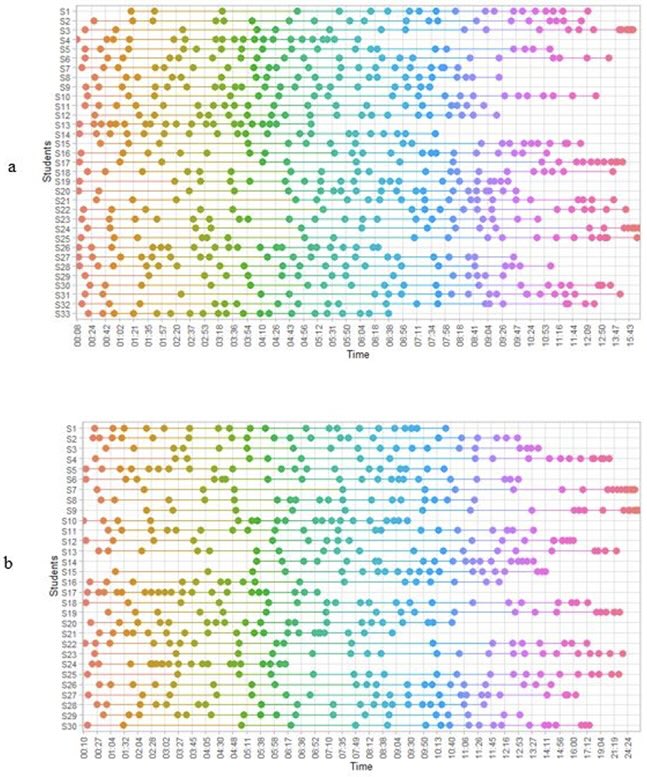
When the graphs were examined, it was noteworthy that the students exhibited similar behavior patterns in both exams. For example: some students completed the exam in a short time (e.g., S4, S13 in proctored exam; S17, S24 in unproctored exam), some took longer (e.g., S17, S25 in proctored exam; S13, S19 in unproctored exam), and the frequency of question transition increased toward the end of the exam (e.g., S3, S24 in proctored exam; S7, S19 in unproctored exam). Apart from this, there were no behaviors that may have been related to cheating, such as waiting until the last minutes of the exam and answering all the questions in a short time (Noorbehbahani et al., 2022). In the unproctored exam, S24 seems to have started the exam within the first 20 seconds and finished the exam after 6 minutes. If there was a student with this pattern towards the end of the exam, we might suspect that student was cheating. For example, S14’s first attempt was made in the fifth minute and the last attempt was made in the fourteenth minute. Other students started the exam on time and regularly navigated between questions.
Since the question navigation in the exam was set sequentially, the students could not return to a question they had already answered. For this reason, a student exhibiting cheating behavior would have been expected to wait through the first minutes of the exam without any question transition. Or if they look up the answers to the questions from a different source, we would have expected the time spent on the questions to be longer. However, the test-taking patterns of the students who took the unproctored exam did not indicate either anomaly when compared to the students who took the proctored exam. The most important difference between the proctored and unproctored group was that while all students completed the proctored exam within 16 minutes, the unproctored exam took up to 24 minutes.
Applied pairwise comparisons answered the second research question. The Shapiro-Wilk test showed a significant departure from normality for time spent on the first question for the proctored (n = 33, Wp = .643, p = .001) and unproctored (n = 30, Wup = .716, p = .001) groups. In addition, the distributions of the features, such as total test time (Wp = .984, p = .904; Wup = .941, p < .095), mean time spent on each question (Wp = .986, p = .934; Wup = .940, p < .090) and median time spent on each question (Wp = .959, p = .237; Wup = .927, p = .040) was investigated. Considering the box plots (Figure 4) and the outliers in the features, Mann-Whitney U tests were applied to investigate whether there were significant differences between proctored and unproctored tests in terms of students’ test-taking behaviors.
Figure 4
Box Plots of Behavioral Features
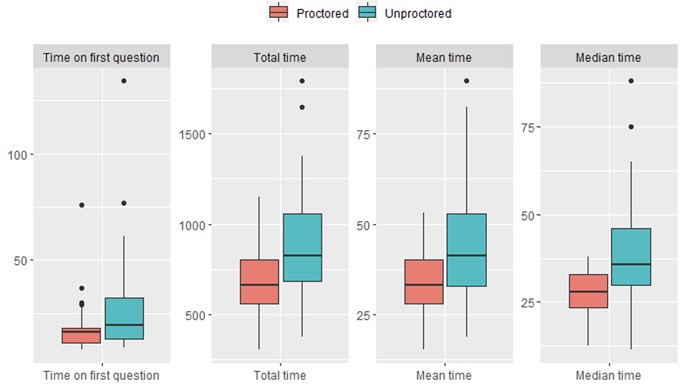
The Mann-Whitney U test indicated that there were significant differences between unproctored and proctored groups in terms of time metrics (Table 4). The time spent on the first question was significantly longer in the unproctored (Mdn = 19.50) than in the proctored exam (Mdn = 16.00, U = 343.50, z = -2.09, p = .037). The total time spent was significantly longer in the unproctored (Mdn = 822.50) than in the proctored exam (Mdn = 662.00, U = 278.00, z = -2.99, p = .003).
Table 4
Results of Mann-Whitney U Test Comparisons of Behavioral Features
| Feature | Proctored (n = 33) | Unproctored (n = 30) | U | z | p | ||
| Mean rank | Sum of ranks | Mean rank | Sum of ranks | ||||
| Time spent on the first question | 27.41 | 904.50 | 37.05 | 1111.5 | 343.50 | -2.09 | .037 |
| Total time spent on the exam | 25.42 | 839.00 | 39.23 | 1177.0 | 278.00 | -2.99 | .003 |
| Mean time spent on each question | 25.65 | 846.50 | 38.98 | 1169.5 | 285.50 | -2.88 | .004 |
| Median time spent on each question | 24.89 | 821.50 | 39.82 | 1194.5 | 260.50 | -3.23 | .001 |
The Mann-Whitney U test also showed that the mean time spent on each question was significantly greater in the unproctored (Mdn = 41.13) than in the proctored exam (Mdn = 33.10, U = 285.50, z = -2.88, p = .004). Similarly, the median time spent on each question was not significantly greater in the unproctored (Mdn = 35.75) than the proctored exam (Mdn = 28.00, U = 260.50, z = -.3.23, p = .001).
The test results indicated that prior knowledge in the proctored (n = 33, Wp = .877, p = .001) and unproctored (n = 30, Wup = .824, p = .001) groups and exam scores in the proctored (n = 33, Wp = .914, p = .012) group did not distribute normally. But the results showed evidence of normality for exam scores in the unproctored (n = 30, Wup = .934, p = .062) group (Figure 5). Thus, Mann-Whitney U Test has been used to comparison of proctored and unproctored groups.
Figure 5
Box Plots of Exam Scores
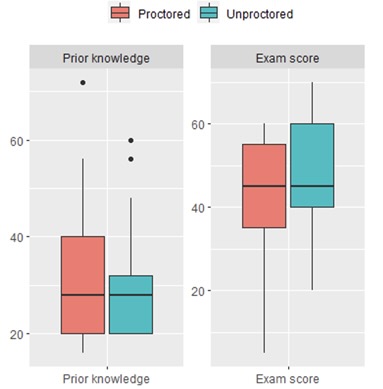
A Mann-Whitney U test indicated that there was no significant difference between the students in the proctored (Mdn = 28.00) and unproctored (Mdn = 28.00) groups in terms of their prior knowledge (U = 476.00, z = -.266, p = .790).
Table 5
Results of Mann-Whitney U Test Comparisons of Exam Scores
| Feature | Proctored (n = 33) | Unproctored (n = 30) | U | z | p | ||
| Mean rank | Sum of ranks | Mean rank | Sum of ranks | ||||
| Prior knowledge | 32.58 | 1075.0 | 31.37 | 941.0 | 476.00 | -.266 | .790 |
| Exam score | 30.44 | 1004.5 | 33.72 | 1011.5 | 443.50 | -.713 | .476 |
According to Table 5, the Mann-Whitney U test also indicated that there was no significant difference between the students in the proctored (Mdn = 45.00) and unproctored (Mdn = 45.00) groups in terms exam scores (U = 443.50, z = -.713, p = .476).
In studies that have reviewed and determined trends in the field, assessment is a key topic (Alin et al., 2022; Bolliger & Martin, 2021; Gurcan, et al., 2021). When comparing assessment in traditional and online learning environments, much higher scores have been obtained in online environments compared to exams conducted in face-to-face environments (Alessio et al., 2018; Daffin & Jones, 2018; Goedl & Malla, 2020). A large-scale longitudinal study conducted at a public state university in Turkey revealed this situation more clearly. In that study, the six-year grades of more than 200,000 students were analyzed, including during the pandemic period. The results of the research showed that the rate of A grades, which was between 29% and 34% in the five-year period prior to the pandemic, increased to 44% during the pandemic period. Similarly, the rate of F grades, which was between 16% and 22% in the pre-pandemic period, decreased to 13% (Analytics Hacettepe, n.d.). This suggests the existence of undesirable behaviors, such as cheating and academic dishonesty. According to the fraud triangle, there are three components to morally realizing this kind of misbehavior—perceived pressures, opportunities, and rationalizations (Becker et al., 2006; Burke & Kenneth 2018; Shbail et al., 2022). It is expected that these behaviors will be prevented by redesigning assessment processes in unproctored environments.
In the literature, it is noteworthy that academic success in unproctored exams conducted within the scope of online/e-assessment has been significantly higher than in proctored exams (Goedl & Malla, 2020). As well, if exams are unproctored, academic outcomes are not reliable in e-assessment (Coghlan et al., 2021; Harmon & Lambrinos, 2008; Snekalatha et al., 2021). Moreover, even in virtual proctored exams, cheating does not appear to be fully resolved (Alin et al., 2022). Alin et al. (2022) identified three strategies for minimizing cheating behaviors. Assessment design is at the forefront of these recommendations. This study, conducted in a course in which formative assessment design (based on the scores of four quizzes, a peer assessment activity, and a face-to-face proctored final exam) was applied, aimed to compare the exam scores and test-taking behaviors of students according to proctored or unproctored situations. The results showed that while there was no significant difference in terms of quiz scores, a significant difference was found in time-based test-taking behaviors of proctored (control) and unproctored (experiment) groups.
The lack of difference in proctored and unproctored exam score indicates that students’ behaviors in the unproctored exam did not affect their quiz scores. Nonetheless, students in the unproctored group spent significantly more time on the exam in total and on each question. This may suggest that students were attempting to cheat. However, since there was no difference in exam scores between proctored and unproctored groups, the reason for the difference in time-based test-taking behaviors may be due to factors such as the Internet speed of students’ online connections. While the proctored group accessed the exam in the laboratory environment through the university network, the unproctored group accessed it from their homes, dormitories, or mobile phones. Since university students often reside in student dormitories, they are likely to have lower Internet bandwidth. This may have accounted for a difference between the request and response times of the Internet user during the change of each question screen after the exam started in the unproctored group.
The literature indicates that misbehaviors decreased during exams when the purpose of the course and the assessment process were shared clearly with the students (Oosterhof et al., 2008). Moreover, Rios and Liu (2017) focused on students’ test-taking behavior, rapid guessing, and scores in formative assessment, and found no significant difference between proctored and unproctored online exams in terms of these variables. The results of the present research supported these studies (Alin et al., 2022; Oosterhof et al., 2008; Rios & Liu, 2017). If a formative assessment design is adopted in online learning, there is an exceedingly rare possibility that cheating behavior will be observed in low-risk exams. This possibility should not raise huge concerns about the fairness of the process.
Within a blended course designed to address limitations imposed by the COVID-19 pandemic, it is unlikely that cheating-related behaviors on exams will be frequently observed in situations where formative assessment scores affect overall performance. In this context, researchers and practitioners may reduce concerns about academic integrity in online courses by moving from a focus on summative assessment to an approach that measures every step of the process and collects evidence of learning at every stage (e.g., Alexandron et al., 2022). The results of this study will guide researchers by having (a) designed low-risk exams by analyzing exam data, (b) created insights about the issues to be considered in the security of exams, and (c) designed intervention systems to be developed in the future.
Due to the experimental design, there are two limitations to the study. First, since the experimental and control groups accessed the exam in different environments, the test-taking behavior in the experimental group may have been affected by the environment, Internet speed, and the devices through which students connected. Second, the exam settings allowed students to take questions in random order and did not allow them to return to a question they had answered. Such a setting is among the main measures to address cheating (Chirumamilla et al., 2020). In this study, time-based metrics that were expected to differ in terms of test-taking behaviors were assessed in such exam settings (e.g., monitoring the use of time; Alin et al., 2022). The research results are not generalizable to an exam setting in which students can move freely and/or questions are not random. In future research, proctored and unproctored statuses can be compared according to different exam settings.
The test-taking behaviors of the students were compared in terms of the groups that took the exam in an unproctored and proctored environment. However, there may be students, especially in unproctored groups, who have different test-taking patterns (e.g., fast responders, late starters, fast finishers, and normal or abnormal behavior). In future research, the behaviors and exam performances of students with different test-taking patterns should be examined in depth.
This study discussed the lack of difference between proctored and unproctored situations by relating it to the assessment design. The absence of differences between groups cannot guarantee a lack of cheating in unproctored groups. In this context, there are definitions of abnormal test-taking behavior in exams (Hu et al., 2018; Tiong & Lee, 2021). Tiong and Lee (2021) labeled a situation as abnormal when the speed was too fast or too slow, and the questions were answered 90% correctly. In the present study, the metrics were time-based. Therefore, future research could separate the students who answered the questions very quickly and were highly successful (abnormal 1) and those who answered questions very slowly and had a lot of success (abnormal 2). These groups may be compared to students who behave normally, both in terms of exams and overall performance. Moreover, some outliers were observed in terms of test-taking behaviors (see Figure 4). Exactly why outliers spend much more time (e.g., time on the first question, mean time) than other students is unknown. If future research proves that outliers cheat, outlier detection may be used to determine cheating behaviors.
The authors have no conflicts of interest to declare that are relevant to the content of this article.
The authors have approved the manuscript for submission.
All procedures performed in the current study involving human participants were in accordance with the ethical standards of the institutional research committee. A consent form was prepared and explained to the participants both while collecting log data and applying the scales. Written informed consent was also obtained from all participants prior to the research in LMS.
The datasets generated during and/or analyzed during the current study are available from the corresponding author on reasonable request.
Alessio, H. M., Malay, N., Maurer, K., Bailer, A. J., & Rubin, B. (2018). Interaction of proctoring and student major on online test performance. The International Review of Research in Open and Distributed Learning, 19(5). https://doi.org/10.19173/irrodl.v19i5.3698
Alexandron, G., Wiltrout, M. E., Berg, A., Gershon, S. K., & Ruipérez-Valiente, J. A. (2022). The effects of assessment design on academic dishonesty, learner engagement, and certification rates in MOOCs. Journal of Computer Assisted Learning, 39(1), 141-153. https://doi.org/10.1111/jcal.12733
Alexandron, G., Yoo, L. Y., Ruipérez-Valiente, J. A., Lee, S., & Pritchard, D. E. (2019). Are MOOC learning analytics results trustworthy? With fake learners, they might not be! International Journal of Artificial Intelligence in Education, 29(4), 484-506. https://doi.org/10.1007/s40593-019-00183-1
Alin, P., Arendt, A., & Gurell, S. (2022). Addressing cheating in virtual proctored examinations: Toward a framework of relevant mitigation strategies. Assessment & Evaluation in Higher Education, 48(3), 262-275. https://doi.org/10.1080/02602938.2022.2075317
Analytic Hacettepe. (n.d.). Learning analytics portal. Retrieved November 2022, from http://analitik.hacettepe.edu.tr/raporlar/1
Arnold, I. J. M. (2016). Cheating at online formative tests: Does it pay off? The Internet and Higher Education, 29, 98-106. https://doi.org/10.1016/j.iheduc.2016.02.001
Balash, D. G., Kim, D., Shaibekova, D., Fainchtein, R. A., Sherr, M., & Aviv, A. J. (2021). Examining the examiners: Students’ privacy and security perceptions of online proctoring services [Paper presentation]. 17th Symposium on Usable Privacy and Security.
Balderas, A., & Caballero-Hernández, J. A. (2021). Analysis of learning records to detect student cheating on online exams: Case study during COVID-19 pandemic [Paper presentation]. Eighth International Conference on Technological Ecosystems for Enhancing Multiculturality, Salamanca, Spain.
Baleni, Z. (2015). Online formative assessment in higher education: Its pros and cons. The Electronic Journal of e-Learning, 13(4), 228-236.
Becker, D. A., Connolly, J., Lentz, P., & Morrison, J. (2006). Using the business fraud triangle to predict academic dishonesty among business students. The Academy of Educational Leadership Journal, 10, 37.
Bin Mubayrik, H. F. (2020). New trends in formative-summative evaluations for adult education. SAGE Open, 10(3). https://doi.org/10.1177/2158244020941006
Bolliger, D. U., & Martin, F. (2021). Critical design elements in online courses. Distance Education, 42(3), 352-372. https://doi.org/10.1080/01587919.2021.1956301
Burke, D. D. S., Kenneth J. (2018). Applying the fraud triangle to higher education: Ethical implications. Journal of Legal Studies Education, 35(1), 5-43. https://doi.org/10.1111/jlse.12068
Cantabella, M., López, B., Caballero, A., & Muñoz, A. (2018). Analysis and evaluation of lecturers’ activity in learning management systems: Subjective and objective perceptions. Interactive Learning Environments, 26(7), 911-923. https://doi.org/10.1080/10494820.2017.1421561
Chirumamilla, A., Sindre, G., & Nguyen-Duc, A. (2020). Cheating in e-exams and paper exams: The perceptions of engineering students and teachers in Norway. Assessment & Evaluation in Higher Education, 45(7), 940-957. https://doi.org/10.1080/02602938.2020.1719975
Coghlan, S., Miller, T., & Paterson, J. (2021). Good proctor or “big brother”? Ethics of online exam supervision technologies. Philosophy & Technology, 34(4), 1581-1606. https://doi.org/10.1007/s13347-021-00476-1
Daffin, L. W., Jr., & Jones, A. A. (2018). Comparing student performance on proctored and non-proctored exams in online psychology courses. Online Learning , 22(1). https://doi.org/10.24059/olj.v22i1.1079
Dominguez, C., Garcia-Izquierdo, F. J., Jaime, A., Perez, B., Rubio, A. L., & Zapata, M. A. (2021). Using process mining to analyze time-distribution of self-assessment and formative assessment exercises on an online learning tool. IEEE Transactions on Learning Technologies, 4(5). https://doi.org/10.1109/TLT.2021.3119224
Draaijer, S., Jefferies, A., & Somers, G. (2018). Online proctoring for remote examination: A state of play in higher education in the EU. In E. Ras & A. Guerrero Roldán (Eds) Technology enhanced assessment TEA 2017: Communications in computer and information science (Vol. 829). Springer. https://doi.org/10.1007/978-3-319-97807-9_8
Epoc Converter. (n.d). Epoch and Unix timestamp conversion tools. Retrieved June 1, 2022, from https://www.epochconverter.com/
Fernandes, S., Flores, M. A., & Lima, R. M. (2012). Students’ views of assessment in project-led engineering education: Findings from a case study in Portugal. Assessment & Evaluation in Higher Education, 37(2), 163-178. https://doi.org/10.1080/02602938.2010.515015
Fraenkel, J. R., Wallen, N. E., & Hyun, H. H. (2012). How to design and evaluate research in education. McGraw-Hill.
Gikandi, J. W., Morrow, D., & Davis, N. E. (2011). Online formative assessment in higher education: A review of the literature. Computers & Education, 57(4), 2333-2351. https://doi.org/10.1016/j.compedu.2011.06.004
Goedl, P. A., & Malla, G. B. (2020). A study of grade equivalency between proctored and unproctored exams in distance education. American Journal of Distance Education, 34(4), 280-289. https://doi.org/10.1080/08923647.2020.1796376
Gurcan, F., Ozyurt, O., & Cagitay, N. E. (2021). Investigation of emerging trends in the e-learning field using latent Dirichlet allocation. The International Review of Research in Open and Distributed Learning, 22(2), 1-18. https://doi.org/10.19173/irrodl.v22i2.5358
Harmon, O. R., & Lambrinos, J. (2008). Are online exams an invitation to cheat? The Journal of Economic Education, 39(2), 116-125. https://doi.org/10.3200/JECE.39.2.116-125
Hu, S., Jia, X., & Fu, Y. (2018). Research on abnormal behavior detection of online examination based on image information. In 10th International Conference on Intelligent Human-Machine Systems and Cybernetics (Vol. 2, pp. 88-91). Hangzhou, China. https://doi.org/10.1109/IHMSC.2018.10127
Hui, B. (2023). Are they learning or guessing? Investigating trial-and-error behavior with limited test attempts [Paper presentation]. LAK23: 13th International Learning Analytics and Knowledge Conference, Arlington, Texas. https://doi.org/10.1145/3576050.3576068
Jaramillo-Morillo, D., Ruipérez-Valiente, J., Sarasty, M. F., & Ramírez-Gonzalez, G. (2020). Identifying and characterizing students suspected of academic dishonesty in SPOCs for credit through learning analytics. International Journal of Educational Technology in Higher Education, 17(1), 45. https://doi.org/10.1186/s41239-020-00221-2
Joshi, A., Vinay, M., & Bhaskar, P. (2021). Impact of coronavirus pandemic on the Indian education sector: Perspectives of teachers on online teaching and assessments. Interactive Technology and Smart Education, 18(2), 205-226. https://doi.org/10.1108/ITSE-06-2020-0087
Lee, K., & Fanguy, M. (2022). Online exam proctoring technologies: Educational innovation or deterioration? British Journal of Educational Technology, 53(3), 475-490. https://doi.org/10.1111/bjet.13182
Man, K., Harring, J. R., Ouyang, Y., & Thomas, S. L. (2018). Response time based nonparametric Kullback-Leibler divergence measure for detecting aberrant test-taking behavior. International Journal of Testing, 18(2), 155-177. https://doi.org/10.1080/15305058.2018.1429446
Martin, F., Bolliger, D. U., & Flowers, C. (2021). Design matters: Development and validation of the online course design elements (OCDE) instrument. The International Review of Research in Open and Distributed Learning, 22(2), 46-71. https://doi.org/10.19173/irrodl.v22i2.5187
Nigam, A., Pasricha, R., Singh, T., & Churi, P. (2021). A systematic review on AI-based proctoring systems: Past, present and future. Education and Information Technologies, 26(5), 6421-6445. https://doi.org/10.1007/s10639-021-10597-x
Noorbehbahani, F., Mohammadi, A., & Aminazadeh, M. (2022). A systematic review of research on cheating in online exams from 2010 to 2021. Education and Information Technologies, 27(6), 8413-8460. https://doi.org/10.1007/s10639-022-10927-7
Oosterhof, A., Conrad, R. M., & Ely, D. P. (2008). Assessing learners online. Pearson.
Pelanek, R. (2021). Analyzing and visualizing learning data: A system designer’s perspective. Journal of Learning Analytics, 8(2), 93-104. https://doi.org/10.18608/jla.2021.7345
Rios, J. A., & Liu, O. L. (2017). Online proctored versus unproctored low-stakes Internet test administration: Is there differential test-taking behavior and performance? American Journal of Distance Education, 31(4), 226-241. https://doi.org/10.1080/08923647.2017.1258628
Shbail, M. O., Alshurafat, H., Ananzeh, H., & Al-Msiedeen, J. M. (2022). Dataset of factors affecting online cheating by accounting students: The relevance of social factors and the fraud triangle model factors. Data in Brief, 40, 107732. https://doi.org/10.1016/j.dib.2021.107732
Singh, U. G., & de Villiers, M. R. (2017). An evaluation framework and instrument for evaluating e-assessment tools. The International Review of Research in Open and Distributed Learning, 18(6). https://doi.org/10.19173/irrodl.v18i6.2804
Slack, H. R., & Priestley, M. (2022). Online learning and assessment during the COVID-19 pandemic: Exploring the impact on undergraduate student well-being. Assessment & Evaluation in Higher Education, 48(3), 1-17. https://doi.org/10.1080/02602938.2022.2076804
Soffer, T., Kahan, T., & Livne, E. (2017). E-assessment of online academic courses via students’ activities and perceptions. Studies in Educational Evaluation, 54, 83-93. https://doi.org/10.1016/j.stueduc.2016.10.001
Snekalatha, S., Marzuk, S. M., Meshram, S. A., Maheswari, K. U., Sugapriya, G., & Sivasharan, K. (2021). Medical students’ perception of the reliability, usefulness and feasibility of unproctored online formative assessment tests. Advances in Physiology Education, 45(1), 84-88. https://doi.org/10.1152/advan.00178.2020
Stowell, J. R., & Bennett, D. (2010). Effects of online testing on student exam performance and test anxiety. Journal of Educational Computing Research, 42(2), 161-171. https://doi.org/10.2190/EC.42.2.b
Thelwall, M. (2000). Computer-based assessment: A versatile educational tool. Computers & Education, 34(1), 37-49. https://doi.org/10.1016/S0360-1315(99)00037-8
Tiong, L. C. O., & Lee, H. J. (2021). e-Cheating prevention measures: Detection of cheating at online examinations using deep learning approach, a case study, ArXiv Preprint. https://doi.org/10.48550/arXiv.2101.09841.
Traoré, I., Nakkabi, Y., Saad, S., Sayed, B., Ardigo, J. D., & de Faria Quinan, P. M. (2017). Ensuring online exam integrity through continuous biometric authentication. In I. Traoré, A. Awad, & I. Woungang (Eds.), Information security practices: Emerging threats and perspectives (pp. 73-81). Springer.
Trezise, K., Ryan, T., de Barba, P., & Kennedy, G. (2019). Detecting academic misconduct using learning analytics. Journal of Learning Analytics, 6(3), 90-104. https://doi.org/10.18608/jla.2019.63.11
Tripathi, A. M., Kasana, R., Bhandari, R., & Vashishtha, N. (2022). Online examination system [Paper presentation]. Fifth International Conference on Smart Trends in Computing and Communications, SmartCom, Singapore.
Vegendla, A., & Sindre, G. (2019). Mitigation of cheating in online exams: Strengths and limitations of biometric authentication. In A. V. S. Kumar (Ed.), Biometric authentication in online learning environments (pp. 47-68). IGI Global.
Vlachopoulos, D. (2016). Assuring quality in e-learning course design: The roadmap. The International Review of Research in Open and Distributed Learning, 17(6). https://doi.org/10.19173/irrodl.v17i6.2784
Yazici, S., Yildiz Durak, H., Aksu Dünya, B., & Şentürk, B. (2023). Online versus face-to-face cheating: The prevalence of cheating behaviours during the pandemic compared to the pre-pandemic among Turkish University students. Journal of Computer Assisted Learning, 39(1), 231-254. https://doi.org/10.1111/jcal.12743

The Effects of Exam Setting on Students' Test-Taking Behaviors and Performances: Proctored Versus Unproctored by Denizer Yıldırım, Hale Ilgaz, Alper Bayazıt, and Gökhan Akçapınar is licensed under a Creative Commons Attribution 4.0 International License.