Volume 25, Number 2
Clemente Rodríguez-Sabiote1,*, Ana T. Valerio-Peña2, Roberto A. Batista-Almonte2, and Álvaro M. Úbeda-Sánchez3
1Faculty of Education Sciences, Campus de Cartuja, University of Granada. Spain; 2Higher Institute of Teacher Training Salomé Ureña, Recinto Emilio Prud’Homme, Dominican Republic; 3Faculty of Humanities and Educational Science. Campus de la Lagunillas, University of Jaén. Spain. *Corresponding Author
The global pandemic caused by the SARS-CoV-2 virus brought about a true revolution in the predominant teaching-learning processes (i.e., face-to-face environment) that had been implemented up to that point. In this regard, virtual teaching-learning environments (VTLEs) have gained unprecedented significance. The main objectives of our research were to define an explanatory theoretical model and to test a multiple serial mediation model with four variables in series (one independent variable plus three mediators) to relate perceived utility (independent variable) in the use of a VTLE and perceived learning (dependent or criterion variable) in such contexts, taking into account the mediation of subjective norm (mediator 1), ease of use (mediator 2), and intention to use behavior (mediator 3), and using the extended technology acceptance model as the theoretical framework. Additionally, we aimed to analyze the direct and indirect relationships and effects among the variables that constituted the proposed model. Methodologically, the research can be classified as a cross-sectional causal ex post facto design. A representative sample of students enrolled in higher education institutions in the Dominican Republic was used as the research population, and a standardized Likert scale was administered to measure the five dimensions of the proposed model. Finally, it is worth noting that the obtained results indicate that all direct and indirect effects considered in the model were statistically significant, except for the indirect effect, where the four predictor variables were arranged in series to verify their influence on the criterion variable: perceived learning.
Keywords: virtual teaching-learning environment, extended technology acceptance model, higher education, information and communications technology
Virtual teaching-learning environments (VTLEs) have become an established reality that has been further reinforced by the COVID-19 pandemic and new educational needs (Adov & Mäeots, 2021; Herrador-Alcaide et al., 2019; Kortemeyer et al., 2023; Williamson et al., 2020) that have emerged in this new context. This is the starting point of our research, which aims to complement the existing scientific literature on VTLEs, but within the context prompted by the COVID-19 crisis among students enrolled in higher education in the Dominican Republic. Formally, these teaching-learning environments can be classified within a broader context known as blended learning (Hrastinski, 2019)—a broad term that refers to a continuum ranging from traditional face-to-face teaching-learning processes to innovative online teaching-learning processes (Garrison & Kanuka, 2004). In the context of VTLEs, learning management systems (LMSs) are valuable for supporting students’ teaching-learning process (Araka et al., 2021; Bansah & Agyei, 2022).
However, at this point, it is worth asking to what extent the teaching-learning process based on these virtual environments can influence perceived learning outcomes among students. With this aim in mind, this research proposal emerged, grounded in a set of hypotheses related to specific variables (perceived usefulness, subjective norm, ease of use, and intention to use) and their influence on perceived learning within VTLE contexts. Thus, conducting a study of this nature and with these characteristics would seek to generate an explanatory theoretical model based on the technology acceptance model (TAM) and subsequent variations as a cornerstone for new pedagogical models and methodologies within VTLEs. Some current references on the practical utility of these models include Martín-García et al. (2019), Schimidthuber et al. (2020), and Ranellucci et al. (2020); the levels of satisfaction of students immersed in these VTLEs are also emphasized (Hamutoglu et al., 2020).
The field of educational practice and research is not immune to the new demands and innovations being developed to provide a rapid and accurate response to each situation that arises. All these changes share a common denominator: the exponential increase in new technologies and digital devices. As a result, a new way of understanding teaching-learning processes is emerging, where students are assuming an increasingly active role as they progress through educational levels, eventually reaching higher education (Gallego-Gómez et al., 2021; Quevedo-Arnaiz et al., 2021).
There are studies that demonstrate this paradigm shift, where new methodologies and active learning are gaining prominence—notably, Mohamed (2021), Rodríguez-Sabiote et al. (2020) Roitsch et al. (2021), and Tan et al. (2021). However, due to the COVID-19 pandemic, the global population was forced to endure periods of confinement. Specifically in the field of education, face-to-face classroom instruction in elementary schools, high schools, universities, and other educational centers had to be replaced with virtual classrooms and environments. Undoubtedly, education has undergone rapid changes in a very short period, and it is not surprising that various difficulties have arisen, such as dealing with misinformation in the media, maintaining the level of engagement in the teaching-learning process, and managing anxiety toward these accelerated changes (Martin et al., 2022; Unger & Meiran, 2020). Thus, processes that were already underway were accelerated, and many changes and innovations that were introduced due to the new reality have ultimately become permanent. In this new context, students and teachers have been compelled to adapt to online learning and distance education in a short time, giving rise to a new model in education in the so-called post-COVID era (Lockee, 2021).
In this context, VTLEs gain significant strength and presence. VTLEs are understood as virtual environments that facilitate pedagogical communication among participants in an educational process, whether fully online, face to face, or in a blended nature that combines both modalities in varying proportions (Weller, 2007). Therefore, VTLEs can be considered as highly potential and functional alternatives that effectively combine technology and pedagogy, enabling the execution of learning activities and tasks across different subjects in virtual environments or classrooms, where both students and teachers can visualize and access various educational resources (Baez-Estrada & Ossandón Núñez, 2015). Furthermore, VTLEs promote collaborative learning, where the teacher acts as a mediator in the learning construction process and students are the protagonists of their own development (Huang et al., 2010). They foster social interaction in the teaching-learning process (Hernández-Sellés, 2021; Limniou & Smith, 2010; Uzunboylu et al., 2011), which is considered one of the main pillars of these platforms and tools.
All of this originates from the TAM proposed by Davis (1989) and from subsequent extended and adapted models (Abdullah & Ward, 2016). The purpose of this model is to explain the factors that determine the use of information and communications technology (ICT) by a significant number of users, suggesting that perceived usefulness and perceived ease of use are determinants of a user’s intention to use a system. This predictive model of ICT use is based on two main variables:
Following the TAM, there are external variables that can directly influence PU and PEoU (Yong-Varela et al., 2010). These external variables indirectly influence attitude toward use, behavioral intention to use, and actual behavior. PEoU has a causal effect on PU, and PU significantly affects an individual’s attitude toward using a particular system, which can be either favorable or unfavorable. Among the external variables that have been studied with great interest in the scientific literature over the years (Bueno & Salmerón, 2008; Huffman & Huffman, 2012; Ngai et al., 2007; Venkatesh, 2000), five can be highlighted: social influence, technological support, cooperation among organization members, academic success, and knowledge need.
The first objective was to define an explanatory theoretical model (extended technology acceptance model) as tested by Urquidi Martín et al. (2019) and to confirm it through a multiple serial mediation model with three mediating variables to relate perceived usefulness (PU) derived from the use of VTLE and perceived learning (PL) in these contexts, taking into account the mediation of subjective norm (SN), perceived ease of use (PEoU), and behavioral intention to use (BIU). The second objective was to analyze the relationships and the given direct, indirect, and total effects among the variables comprising this model. Based on these research objectives, a series of hypotheses were derived. These hypotheses are based on model 6 proposed by Hayes (2022) within the mediation models, which will be discussed in detail in the methodology section. The following hypotheses are enumerated accordingly.
The following hypotheses were derived from the indirect effects of the predictor (x = PU) on the criterion (y = PL) modulated by a single mediator (indirect effect of x on y through only mi = aibi):
hypothesis 1: greater PU derived from the use of a VTLE, along with a stronger SN imposed within this environment, enhance PL: Ind1 = PU→SN→PL or, alternatively, m1 SN ~ PU.
hypothesis 2: greater PU derived from the use of a VTLE, combined with a higher PEoU, increase PL: Ind2 = PU→PEoU→PL or, alternatively, m2 PEoU ~ PU.
hypothesis 3: greater PU derived from the use of a VTLE, coupled with a higher BIU, enhance PL: Ind3 = PU→BIU→PL or, alternatively, m3 BIU ~ PU.
Hypotheses With Two and Three Mediators
The following hypotheses were derived from the indirect effects of the predictor (x = PU) on the criterion (y = PL) modulated by two or three mediators (indirect effect of x on y through m1, m2, m3 in serial):
hypothesis 4: greater PU derived from the use of a VTLE, along with a stronger SN imposed within this environment, as well as a higher PEoU within the same environment, enhance PL: Ind1 = PU→SN→PEoU→PL.
hypothesis 5: greater PU derived from the use of a VTLE, coupled with a stronger SN imposed within this environment, as well as a higher BIU within the same environment, enhance PL: Ind2 = PU→SN→BIU→PL.
hypothesis 6: greater PU derived from the use of a VTLE, along with a higher PEoU and a higher BIU within the same environment, enhance PL: Ind3 = PU→PEoU→BIU→PL.
hypothesis 7: greater PU derived from the use of a VTLE, combined with a stronger SN imposed within this environment, associated with a higher PEoU within the same environment, as well as a higher BIU, enhance PL: Ind4 = PU→SN→PEoU→BIU→PL.
The study considers five distinct variables, which are actually latent dimensions formed by grouping observable variables (scale items) of the proposed model: PU, SN, PEoU, BIU, and PL. The role and definition of each variable in the proposed model are as follows (Urquidi Martín et al., 2019, p. 6):
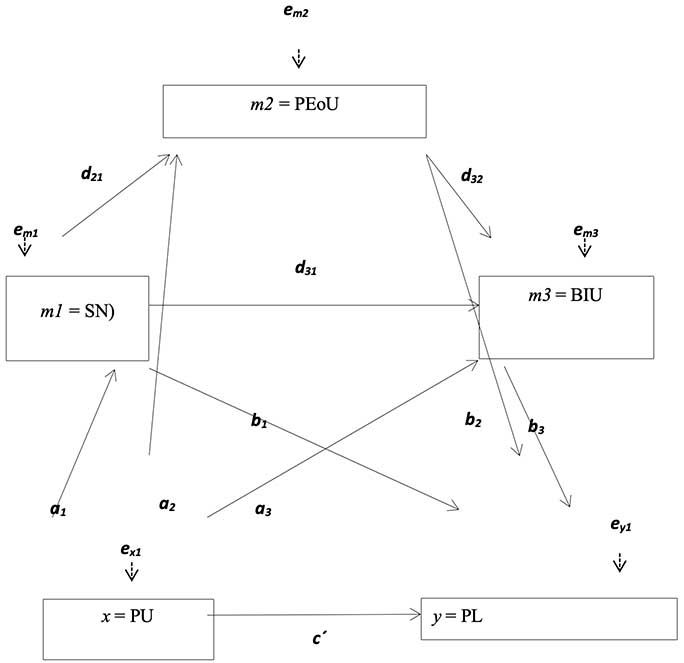
The methodology used in the research follows an ex post facto correlational-predictive design of a cross-sectional nature, characterized by establishing relationships of covariation and regression among variables of different nature—namely, independent, dependent, and mediator variables—aiming to confirm a specific mediation model. The model being tested is model 6 proposed by Hayes (2022). This model is a mediation model that involves a criterion or dependent variable y = PL, an independent variable x = PU, and three sequential or serial mediator variables, namely, m1 = SN, m2 = PEoU, and m3 = BIU. Conceptually, it can be referred to as a multiple mediation model with three variables in a series. The model can be represented schematically using a statistical diagram, where, in addition to the five variables, each of the regression coefficients (β) or standardized/unstandardized slopes corresponding to the regression equations that make up the model are represented by letters (Figure 1). In our case, we would have the following regression coefficients: a1, a2, b1, b2, b3, d21, d31, and c', along with an overall coefficient c (total effect not shown in the diagram), as well as different errors (en) associated with the different regression coefficients.
Figure 1
Statistical Diagram (Model 6 With Three Mediators)
Note. PEoU = perceived ease of use; SN = subjective norm; BIU = behavioral intention to use; PU = perceived usefulness; PL = perceived learning; indirect effect of x on y through mi only = aibi (a1b1, a2b2, and a3b3); indirect effect of x on y through m1 and m2 in serial = a1d21b2; indirect effect of x on y through m 1 and m 3 in serial = a1d31b3; indirect effect of x on y through m2 and m3 in serial = a2d32b3; indirect effect of x on y through m1, m2, and m3 in serial = a1d21d32b3; direct effect of x on y = c´.
For data collection, a single instrument was used: the measurement scale of the extended technology acceptance model (MSETAM) by Urquidi Martín et al. (2019). There are three reasons for using a single instrument. The first is that it is properly standardized in terms of reliability, internal consistency, and concurrent and construct criterion validity (Urquidi Martín et al., 2019). It also has content validity, as it was developed by adapting several previously standardized instruments. The sources of the dimensions and items that constitute the instrument are presented in Table 1.
Table 1
Sources of the Dimensions of the Instrument
| Scale dimension | Sources |
| PU | Arteaga Sánchez & Duarte Hueros (2010); Davis (1989); Islam (2013); Premkumar & Bhattacherjee (2008) |
| SN | Sánchez-Prieto et al. (2017) |
| PEoU | Arteaga Sánchez & Duarte Hueros (2010); Davis (1989); Islam (2013); Premkumar & Bhattacherjee (2008) |
| BIU | Arteaga Sánchez & Duarte Hueros (2010); Davis (1989); Islam (2013); Premkumar & Bhattacherjee (2008) |
| PL | Islam (2013) |
Note: PU = perceived usefulness; SN = subjective norm; PEoU = perceived ease of use; BIU = behavioral intention to use; PL = perceived learning. Adapted from “Entornos virtuales de aprendizaje: modelo ampliado de aceptación de la tecnología [Virtual Learning Environments: Extending the Technology Acceptance Model],” by A. C. Urquidi Martín, M. S. Calabor-Prieto, & C. Tamarit-Aznar, 2019, Revista Electrónica de Investigación Educativa, 21, p. 6 (https://doi.org/10.24320/redie.2019.21.e22.1866). Copyright 2019 by the Revista Electrónica de Investigación Educativa.
The second reason for using a single instrument is that the scale consists of 20 items (5 items for each included dimension), making it a short and easy-to-complete scale. The third reason is that the instrument is structured around the dimensions that will constitute the mediation model being tested. The MSETAM used in this study is composed of five dimensions, PU, SN, PEoU, BIU, and PL, each consisting of four items. The response format is a Likert-type scale ranging from 1 to 5 (1 = strongly disagree; 5 = strongly agree). The scale was administered online.
The sample size of this research was 407 students from 15 public and private universities or higher education institutions in the Dominican Republic. Of these, 108 were male and 299 were female, with ages ranging from 17 to 54 years (M = 25.86, SD = 7.35). No specific sampling technique was used, as the instrument was made available to the target population in an online format. The population from which the sample was drawn was approximately 580,000 individuals (i.e., students enrolled in higher education in the Dominican Republic during the 2020-2021 academic year, the latest year for which data were available). For this particular study, the sample size was determined based on the following parameters: significance level (1-α) = 0.95, sampling error = ±4.8%, and unknown proportions (p = q = 0.5). Once the sample size was calculated to be approximately n = 471, the instrument was administered online. Sample attrition amounted to 64 participants (13.58%), which was not a cause for concern, as the focus was on the proportion of participants per variable (subject to variables [STV]). The resulting STV ratio was 20.35 (407/20). While the minimum value for STV is relative and varies depending on the consulted author, a minimum value of 10 is recommended (Garson, 2008). Our value was comfortably above this threshold (20.35 > 10). The data collection process is described in more detail in the procedure section.
The scale used in our study has been properly standardized and demonstrates the necessary psychometric properties, including content and construct validity. We will now present the results obtained for the complete scale and the various subscales in terms of reliability (internal consistency) and concurrent criterion validity in the context of our particular study.
For internal consistency reliability, we calculated Cronbach’s alpha (α) coefficient and McDonald’s omega (ω) coefficient after a single administration of the instrument. For concurrent criterion validity, we calculated the corrected item-total correlation. The results for both aspects are presented in Table 2 and discussed below.
Table 2
Scale and Subscales Reliability Statistics
| Scale/subscale | Cronbach’s α | McDonald’s ω |
| Subscale PU (4 items) | 0.838 | 0.844 |
| Subscale SN (4 items) | 0.877 | 0.878 |
| Subscale PEoU (4 items) | 0.705 | 0.725 |
| Subscale BIU (4 items) | 0.891 | 0.894 |
| Subscale PL (4 items) | 0.849 | 0.853 |
| Full scale (20 items) | 0.950 | 0.954 |
Note. PU = perceived usefulness; SN = subjective norm; PEoU = perceived ease of use; BIU = behavioral intention to use; PL = perceived learning.
The results for the reliability coefficients, Cronbach’s α and McDonald’s ω, indicate high internal consistency for the evaluated subscales, except for the isolated case of the PEoU subscale, which shows slightly lower internal consistency. Notably, the overall scale demonstrated high internal consistency with α = 0.950 and ω = 0.954. In conclusion, moderately high α and ω values were obtained, indicating good internal consistency of the scale as a whole (Zumbo et al., 2007), with slightly lower consistency for the PEoU subscale.
Regarding criterion validity, we calculated the corrected item-total correlation or item-rest correlation, which represents the correlation between each item and the total score of the scale after removing that particular item. In most cases, the reported correlations were r > 0.65, suggesting that most items in the scale accurately measured the same construct as the total scale (internal consistency criterion).
To test the proposed mediation hypotheses, we employed the PROCESS macro for SPSS v4.0 (Hayes, 2022) using the bootstrapping method. This strategy is advantageous for addressing violations of parametric assumptions such as normality and small sample sizes (although this is not the case in our study). It is considered a more robust approach Hayes & Rockwood, 2020) than, for example, jackknifing method or permutation tests. The bootstrapping method is based on repeated random sampling with replacement from the data set to calculate the desired statistic for each resample, in our case with 10,000 bootstrap samples. Its major advantage over the initial methods used in sequential mediation models (e.g., Baron & Kenny, 1986) and the Sobel test (Preacher & Hayes, 2004) is its ability to provide point estimates and confidence intervals. With the help of these confidence intervals, we can assess whether the mediation effect is statistically significant (Igartura & Hayes, 2021).
Table 3
Regression Analysis and Total, Direct, and Indirect Effects of x on y
| Outcome variable: Subjetive Norm (SN) Model summary | ||||||
| R | R-sq | MSE | F | df1 | df2 | p |
| .73 | .53 | 6.75 | 456.29 | 1 | 405 | .000*** |
| Model | Coeff. | Se | T | p | LLCI | ULCI |
| constant | 3.34 | .55 | 6.04 | .000*** | 2.25 | 4.42 |
| PU | .76 | .04 | 21.36 | .000*** | .69 | .83 |
| Standardized coefficient PU = .73 (a1) | ||||||
| Outcome variable: Perceived Easy Use (PEOU) Model summary | ||||||
| R | R-sq | MSE | F | df1 | df2 | p |
| .67 | .45 | 5.50 | 162.70 | 2 | 404 | .000*** |
| Model | Coeff | Se | T | p | LLCI | ULCI |
| constant | 5.12 | .52 | 9.83 | .000*** | 4.10 | 6.14 |
| PU | .47 | .05 | 9.96 | .000*** | .37 | .56 |
| SN | .14 | .04 | 3.07 | .000*** | .05 | .23 |
| Standardized coefficients PU = .54 (d21); SN = .14(a2) | ||||||
| Outcome variable: Behavioural Intention Use(BIU) Model summary | ||||||
| R | R-sq | MSE | F | df1 | df2 | p |
| .86 | .74 | 3.83 | 391.86 | 3 | 403 | .000*** |
| Model | Coeff | Se | T | p | LLCI | ULCI |
| constant | .99 | .48 | 2.05 | .04* | .04 | 1.94 |
| PU | .32 | .04 | 7.38 | .000*** | .24 | .41 |
| SN | .55 | .04 | 14.64 | .000*** | .48 | .63 |
| PEoU | .13 | .04 | 3.17 | .000*** | .05 | .21 |
| Standardized coefficients PU = .30 (a3); SN = .54(d31); PEOU = .11(d32) | ||||||
| Outcome variable: Perceived Learning (PL) Model summary | ||||||
| R | R-sq | MSE | F | df1 | df2 | p |
| .86 | .69 | 3.99 | 224.98 | 4 | 402 | .000*** |
| Model | Coeff | Se | T | p | LLCI | ULCI |
| constant | 1.74 | .50 | 3.51 | .000*** | .76 | 2.71 |
| PU | .18 | .04 | 7.38 | .000*** | .09 | .27 |
| SN | .30 | .04 | 14.64 | .000*** | .21 | .39 |
| PEoU | .26 | .04 | 3.17 | .000*** | .18 | .34 |
| BIU | .20 | .05 | 4.01 | .000*** | .10 | .30 |
| Standardized coefficients PU = .18 (c´); SN = .32 (b1); PEOU = .23 (b2); BIU = .22 (b3) | ||||||
| TOTAL EFFECT MODEL Outcome variable: Perceived Learning (PL) Model summary | ||||||
| R | R-sq | MSE | F | df1 | df2 | p |
| .73 | .54 | 5.94 | 486.93 | 405 | 1151 | .000*** |
| Model | Coeff. | Se | T | p | LLCI | ULCI |
| constant | 4.91 | .52 | 9.48 | .000*** | 3.89 | 5.93 |
| PU | .72 | .03 | 21.65 | .000*** | .66 | .79 |
| Standardized coefficient PU = .73 (a1) | ||||||
| TOTAL AND DIRECT EFFECT OF X ON Y Total effect of X on Y | |||||||
| Effect | Se | t | P | LLCI | ULCI | c_ps | c_cs |
| .72 | .03 | 21.65 | .000*** | .66 | .79 | .20 | .73 |
| Standardized coefficient PU = .73 (a1) | |||||||
| Direct effect of X on Y | |||||||
| Effect | Se | t | P | LLCI | ULCI | c_ps | c_cs |
| .18 | .05 | 3.81 | .000*** | .09 | .27 | .05 | .18 |
| Standardized coefficient PU = .18 (total) | |||||||
Note. *p < .05, **p < .01, ***p < .001.
Level of confidence for all confidence intervals in output: 95%
Number of bootstrap samples for percentile bootstrap confidence intervals: 10000.
After applying the PROCESS program, the results regarding the various regression equations that statistically support model 6 are presented. In this regard, we can observe the different regression analyses developed as follows:
Empirical confirmation seems to support the relevance and possibility of including the main predictor (PU) and its mediators (SN, PEoU, and BIU) as variables that can help predict PL. Figure 2 presents a diagram of the inferred model with the calculated parameters.
Figure 2
Statistical Diagram With Coefficients (Model 6 With Three Mediators)
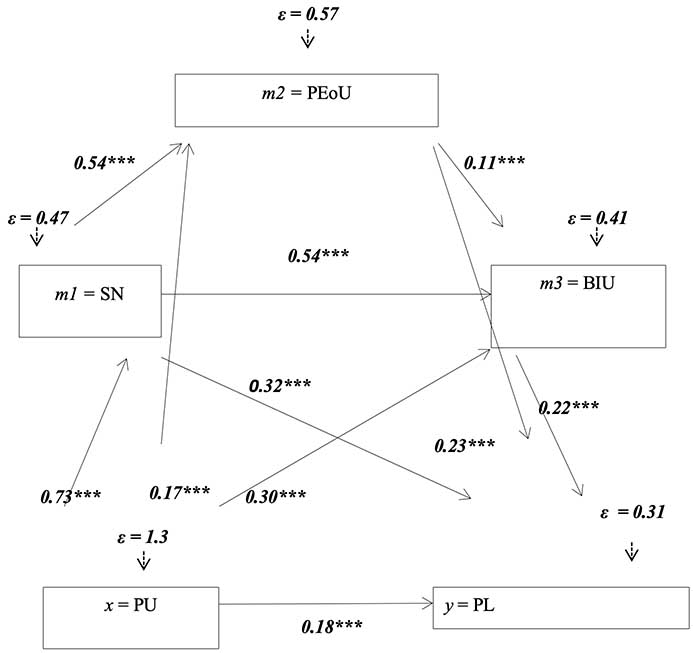
Note. PEoU = perceived ease of use; SN = subjective norm; BIU = behavioral intention to use; PU = perceived usefulness; PL = perceived learning. Indirect effect of x on y through mi only = aibi (a1b1, a2b2, and a3b3). Indirect effect of x on y through m1 and m2 in serial = a1d21b2. Indirect effect of x on y through m1 and m3 in serial = a1d31b3. Indirect effect of x on y through m2 and m3 in serial = a2d32b3. Indirect effect of x on y through m1, m2, and m3 in serial = a1d21d32b3. Direct effect of x on y = c´. Betas are completely standardized.
* p < 0.05. ** p < 0.01. *** p < 0.001.
Second, we present the results concerning the mediating indirect effects, as well as the comparison between them using binomial tests to either accept or reject each of the seven hypotheses proposed (Table 4).
Table 4
Completely Standardized Indirect Effect(s) of x on y
| Types of effects | Effect | Boot_SE | Boot_LLCI | Boot_ULCI |
| Total | 0.55 | 0.04 | 0.47 | 0.63 |
| Ind1^ | 0.23 | 0.04 | 0.15 | 0.32 |
| Ind2^ | 0.12 | 0.03 | 0.07 | 0.18 |
| Ind3^ | 0.07 | 0.02 | 0.03 | 0.11 |
| Ind4^ | 0.03 | 0.01 | 0.01 | 0.05 |
| Ind5^ | 0.09 | 0.03 | 0.04 | 0.14 |
| Ind6^ | 0.01 | 0.01 | 0.01 | 0.03 |
| Ind7 | 0.00 | 0.00 | 0.00 | 0.01 |
| Specific indirect effect contrast definition(s) | ||||
| C1 (Ind1 vs. Ind2) | 0.11 | 0.06 | 0.00 | 0.23 |
| C2 (Ind1 vs. Ind3)^ | 0.16 | 0.06 | 0.06 | 0.27 |
| C3 (Ind1 vs. Ind4)^ | 0.20 | 0.05 | 0.11 | 0.29 |
| C4 (Ind1 vs. Ind5) ^ | 0.14 | 0.06 | 0.02 | 0.26 |
| C5 (Ind1 vs. Ind6) ^ | 0.22 | 0.05 | 0.13 | 0.31 |
| C6 (Ind1 vs. Ind7) ^ | 0.23 | 0.04 | 0.14 | 0.31 |
| C7 (Ind2 vs. Ind3) | 0.06 | 0.04 | -0.02 | 0.13 |
| C8 (Ind2 vs. Ind4) ^ | 0.10 | 0.04 | 0.04 | 0.16 |
| C9 (Ind2 vs. Ind5) | 0.04 | 0.04 | -0.05 | 0.12 |
| C10 (Ind2 vs. Ind6) ^ | 0.11 | 0.03 | 0.05 | 0.17 |
| C11 (Ind2 vs. Ind7) ^ | 0.12 | 0.03 | 0.06 | 0.18 |
| C12 (Ind3 vs. Ind4) | 0.04 | 0.02 | -0.01 | 0.09 |
| C13 (Ind3 vs. Ind5) | -0.02 | 0.02 | -0.06 | 0.01 |
| C14 (Ind3 vs. Ind6) ^ | 0.05 | 0.02 | 0.02 | 0.10 |
| C15 (Ind3 vs. Ind7) ^ | 0.06 | 0.02 | 0.03 | 0.11 |
| C16 (Ind4 vs. Ind5) | -0.06 | -0.03 | -0.12 | 0.00 |
| C17 (Ind4 vs. Ind6) | 0.01 | 0.01 | -0.01 | 0.04 |
| C18 (Ind4 vs. Ind7) ^ | 0.02 | 0.01 | 0.01 | 0.04 |
| C19 (Ind5 vs. Ind6) | 0.07 | 0.02 | 0.03 | 0.12 |
| C20 (Ind5 vs. Ind7) ^ | 0.08 | 0.03 | 0.04 | 0.14 |
| C21 (Ind6 vs. Ind7) | 0.01 | 0.00 | 0.00 | 0.02 |
Note. LLCI = lower limit confidence interval; ULCI = upper limit confidence interval; PU = perceived usefulness; SN = subjective norm; PL = perceived learning; PEoU = perceived ease of use; BIU = behavioral intention to use. ^confidence interval (boot LLCI-boot ULCI) does not cover the value 0→statistically significant. Indirect effect key: Ind1 PU→SN→PL; Ind2 PU→PEoU→PL; Ind3 PU→BIU→PL; Ind4 PU→SN→PEoU→PL; Ind5 PU→SN→BIU→PL; Ind6 PU→PEoU→BIU→PL; Ind7 PU→SN→PEoU→BIU→PL.
As can be seen from the seven direct effects, six were statistically significant, considering that at a 95% confidence level, confidence intervals (boot LLCI-boot ULCI) have been estimated that do not include the value 0 (Hayes, 2022). Specifically, the statistically significant indirect effects include all but one, which is the indirect effect 7 (Ind7). In this effect, we obtained a standardized coefficient β = 0, associated with a standard error boot = 0, which, considering a 95% confidence level, yields a confidence interval of 0.00-0.01, where the value 0 is indeed included, indicating the non significance of the contemplated effect (Hayes, 2022).
Another relevant aspect, once the indirect effects have been examined, is to determine which are more significant and whether there are statistically significant differences among them (post hoc contrasts). For this procedure, the seven indirect effects were compared using binomial tests. In this way, a total of 21 comparisons were conducted, corresponding to the combinations of seven elements taken two at a time (C27 = 7! / 2! × [7 - 2]!). Out of these 21 comparisons, 12 were statistically significant, meaning that their confidence intervals (boot LLCI-boot ULCI) did not include the value 0. In more detail, the indirect effects with statistically significant differences when compared to each other are comparisons 2, 3, 4, 5, 6, 8, 10, 11, 14, 15, 18, and 20. On the other hand, the remaining comparisons—1, 7, 9, 12, 13, 16, 17, 19, and 21—were not statistically significant, as they included the value 0 in the confidence intervals (boot LLCI-boot ULCI).
Furthermore, the comparisons that showed the greatest differences among the indirect effects were those with higher standardized effects β, which corresponded to the comparisons involving the indirect effect 1 (Ind1 = PU→SN→PL) with the other indirect effects.
The results obtained regarding the three initial hypotheses (hypotheses 1, 2, and 3) indicate that PU is a good predictor of PL when mediated by each mediator individually, namely SN, PEoU, and BIU.
As a result, we can conclude that higher PU derived from the use of a VTLE in the teaching and learning process, along with a stronger subjective norm imposed within this environment, increases PL. Additionally, higher PU derived from the use of a VTLE, coupled with a greater PEoU, enhances PL. Finally, higher PU resulting from the use of a VTLE, combined with a greater BIU, increases PL.
Furthermore, regarding hypotheses with two mediators (hypotheses 4, 5, and 6) and three mediators (hypothesis 7) in series, we also observed that PU is an excellent predictor of PL when mediated by SN and PEoU in series, when mediated by SN and BIU in series, and when mediated by PEoU and BIU in series. However, no empirical evidence was found to conclude that PU is a good predictor of PL when mediated by SN, PEoU, and BIU, all in series.
Based on these findings, we can conclude that higher PU derived from the use of a VTLE, along with a stronger SN imposed within this environment, as well as a greater PEoU within the same environment, increases PL. Similarly, higher PL derived from the use of a VTLE, coupled with a stronger SN imposed within this environment, and a greater BIU, also enhance PL. Finally, we can also conclude that higher PU derived from the use of a VTLE, along with a greater PEoU and a higher BIU, increases PL. However, we cannot conclude that higher PU when using a VTLE, combined with a stronger SN imposed within this environment, a greater PEoU within the same framework, and a higher BIU, increases PL.
Furthermore, the total and direct effects of the model were also found to be statistically significant. Therefore, it can be concluded that PU is a good predictor of PL in VTLE, both when it directly influences learning and when it does so through the mediation of subjective norm, ease of use, and intention to use.
When comparing our conclusions with those of other studies, we found a solid agreement with the findings obtained from other research. Considering the specific characteristics and specific approaches of the different studies selected for this comparative purpose, we observe that they indeed bear a considerable resemblance to our conclusions. However, we do note a difference with some of these studies. For example, in the work of Urquidi Martín et al. (2019), PEoU did not prove to be an influential variable in PL. On the other hand, we highlight the works of Baez-Estradas and Ossandón Núñez (2015), Calderón et al. (2020), Islam (2013), Montagud Mascarell and Gandía Cabedo (2014), Hernández-Sellés (2021), Ranellucci et al. (2020), Talantis et al. (2020), Severt et al. (2020), Schepers and Wetzels (2007), Şimşek and Ateş (2022), Tırpan and Bakirtas (2020), and Wismantoro et al. (2020), whose findings are more in line with those obtained in the present research. All these findings propose the TAM model and its different variants as a robust reference model for determining the effectiveness of VTLE and LMS as environments where certain mediating variables can determine PL (Murillo et al., 2021).
This study has several limitations, primarily related to methodological aspects. For instance, the sample size, although adequate, could be larger in future explorations to ensure greater representativeness by including more private and public institutions in the Dominican Republic. Another concern is the imbalance of gender representation among study participants. In this case, female participants accounted for nearly 75% of the total sample, which led the researchers in a previous study (Rodríguez-Sabiote et al., 2023) to conduct a confirmatory factor analysis on the administered scale, examining gender invariance. The results indicated that the factorial structure is similar for men and women. Therefore, it can be concluded that the scale is consistent, valid, and invariant in determining PL in VTLEs within the extended TAM in the Dominican context. Another limitation encountered in this study was the difficulty comparing the conclusions with previously published research in the scientific literature, as very few studies consider PL as a criterion variable within the extended acceptance model of learning.
The use of VTLEs in distance education, research, and practice has a number of implications. Some of the most relevant ones are as follows. Regarding education, we highlight global access, time flexibility, interactivity, and multimedia. For research, we highlight access to global resources, remote data collection, and international collaboration. Finally, for practice, distance education can be useful for teleworking, lifelong learning, cost reduction, and improved work-life balance.
The authors will provide the raw data on which the conclusions of this article are based without any reservations.
The study conducted adhered to all necessary ethical aspects. In this regard, the Ethics Committee of the “Higher Institute of Teacher Training Salomé Ureña (ISFODOSU)” ensured the anonymity of the participants, and it was ensured that none of the items on the administered scale posed a threat to the physical, psychological, and/or social profiles of the participants.
Clemente Rodríguez-Sabiote analyzed and interpreted the data. Álvaro Úbeda-Sánchez, Roberto Batista-Almonte and Ana Teresa Valerio-Peña contributed to the development of the theoretical framework and data collection. All authors made significant contributions to the development and writing of this article and have conceived and designed the work.
This work is part of a research project funded by the “Higher Institute of Teacher Training Salomé Ureña (ISFODOSU), with reference “VRI-INV-G-2020-26” entitled “Perceived Usefulness and Competencies of Dominican University Students in Virtual Learning Environments: An Analysis of Multiple Serial Mediation.”
The authors declare that the research was conducted in the absence of any commercial or financial relationships that could be construed as a potential conflict of interest.
Our sincere thanks to the authorities of “Higher Institute of Teacher Training Salomé Ureña” and all the participants who completed the scale.
Abdullah, F., & Ward, R. (2016). Developing a general extended technology acceptance model for e-learning (GETAMEL) by analysing commonly used external factors. Computers in Human Behavior, 56, 238-256. https://doi.org/10.1016/j.chb.2015.11.036
Adov, L., & Mäeots, M. (2021). What can we learn about science teachers’ technology use during the COVID-19 pandemic? Education Sciences, 11(6), Article 255. https://doi.org/10.3390/educsci11060255
Araka, E., Maina, E., Gitonga, R., Oboko, R., & Kihoro, J. (2021). University students’ perception on the usefulness of learning management system features in promoting self-regulated learning in online learning. International Journal of Education and Development using Information and Communication Technology, 17(1), 45-64. https://eric.ed.gov/?id=EJ1285531
Arteaga Sánchez, R., & Duarte Hueros, A. (2010). Motivational factors that influence the acceptance of Moodle using TAM. Computers in Human Behavior, 26(6), 1632-1640. https://doi.org/10.1016/j.chb.2010.06.011
Baez-Estradas, M. L., & Ossandón Núñez, Y. (2015). Propiedades psicométricas de la escala de presencia social de las mentes en red y su aplicación en el Entorno Virtual de Enseñanza Aprendizaje UTAmed [Psychometric properties networked minds social presence measure and its application in the teaching learning virtual environment UTAmed]. Universitas Psychologica, 14(3), 843-854. https://doi.org/10.11144/Javeriana.upsy14-3.ppep
Bansah, A. K., & Darko Agyei, D. (2022). Perceived convenience, usefulness, effectiveness and user acceptance of information technology: Evaluating students’ experiences of a learning management system. Technology, Pedagogy and Education, 31(4), 431-449. https://doi.org/10.1080/1475939X.2022.2027267
Baron, R. M., & Kenny, D. A. (1986). The moderator—mediator variable distinctions in social psychological research: Conceptual, strategic and statistical considerations. Journal of Personality and Social Psychology, 51(6), 1173-1182. https://doi.org/10.1037/0022-3514.51.6.1173
Bueno, S., & Salmerón, J. L. (2008). TAM-based success modeling in ERP. Interacting with Computers, 20(6), 515-523. https://doi.org/10.1016/j.intcom.2008.08.003
Calderón, S. J., Tumino, M. C., & Bournissen, J. M. (2020). Realidad virtual: impacto en el aprendizaje percibido de estudiantes de Ciencias de la Salud [Virtual reality: Impact on the perceived learning of students of health sciencies]. Tecnología, Ciencia y Educación, 16, 65-82. https://doi.org/10.51302/tce.2020.441
Davis, F. D. (1989). Perceived usefulness, perceived ease of use, and user acceptance of information technology. MIS Quarterly, 13(3), 319-340. https://doi.org/10.2307/249008
Gallego-Gómez, C., De-Pablos-Heredero, C., & Montes-Botella, J. L. (2021). Change of processes in the COVID-19 scenario: From face-to-face to remote teaching-learning systems. Sustainability, 13(19), Article 10513. https://doi.org/10.3390/su131910513
Garrison, D. R., & Kanuka, H. (2004). Blended learning: Uncovering its transformative potential in higher education. Internet and Higher Education, 7(2), 95-105. https://doi.org/10.1016/j.iheduc.2004.02.001
Garson, D. G. (2008). Factor analysis: Statnotes. North Carolina State University, Public Administration Program. https://docplayer.net/19094979-Factor-analysis-statnotes-from-north-carolina-state-university-public-administration-program-factor-analysis.html
Hamutoglu, N. B., Gemikonakli, O., Duman, I., Kirksekiz, A., & Kiyici, M. (2020). Evaluating students experiences using a virtual learning environment: Satisfaction and preferences. Educational Technology Research and Development, 68, 437-462. https://doi.org/10.1007/s11423-019-09705-z
Hayes, A. F. (2022). Introduction to mediation, moderation, and conditional process analysis: A regression-based approach (3rd ed.). Guilford Press.
Hayes, A. F., & Rockwood, N. J. (2020). Conditional process analysis: Concepts, computation, and advances in modeling of the contingencies of mechanisms. American Behavioral Scientist, 64, 19-54 https://doi.org/10.1177/0002764219859633
Hernández-Sellés, N. (2021). La importancia de la interacción en el aprendizaje en entornos virtuales en tiempos del COVID-19 [The relevance of interaction in virtual learning environments during COVID-19]. Publicaciones, 51(3), 257-275. https://doi.org/10.30827/publicaciones.v51i3.18518
Herrador-Alcaide, T. C., Hernández-Solís, M., & Sanguino Galván, R. (2019). Feelings of satisfaction in mature students of financial accounting in a virtual learning environment: an experience of measurement in higher education. International Journal of Educational Technology in Higher Education, 16(1), Article 20. https://doi.org/10.1186/s41239-019-0148-z
Hrastinski, S. (2019). What do we mean by blended learning? Tech Trends, 63, 564-569. https://doi.org/10.1007/s11528-019-00375-5
Huang, H.M., Rauch, U., & Liaw, S. S. (2010). Investigating learners’ attitudes toward virtual reality learning environments: Based on a constructivist approach. Computers & Education, 55(3), 1171-1182. https://doi.org/10.1016/j.compedu.2010.05.014
Huffman, W. H., & Huffman, A. H. (2012). Beyond basic study skills: The use of technology for success in college. Computers in Human Behavior, 28(2), 583-590. https://doi.org/10.1016/j.chb.2011.11.004
Igartua, J.J., & Hayes, A. F. (2021). Mediation, moderation, and conditional process analysis: Concepts, computations, and some common confusions. The Spanish Journal of Psychology, 24, Article e49. https://doi.org/10.1017/SJP.2021.46
Islam, A. K. M. N. (2013). Investigating e-learning system usage outcomes in the university context. Computers & Education, 69, 387-399. https://doi.org/10.1016/j.compedu.2013.07.037
Kortemeyer, G., Dittmann-Domenichini, N., Schlienger, C., Spilling, E., Yaroshchuk, A., & Dissertori, G. (2023). Attending lectures in person, hybrid or online—How do students choose, and what about the outcome? International Journal of Educational Technology in Higher Education, 20(1), Article 19. https://doi.org/10.1186/s41239-023-00387-5
Limniou, M., & Smith, M. (2010). Teachers’ and students’ perspectives on teaching and learning through virtual learning environments. European Journal of Engineering Education, 35(6), 645-653.https://doi.org/10.1080/03043797.2010.505279
Lockee, B. B. (2021). Online education in the post-COVID era. Nature Electronics, 4(1), 5-6. https://doi.org/10.1038/s41928-020-00534-0
Martin, F., Xie, K., & Bolliger, D. U. (2022). Engaging learners in the emergency transition to online learning during the COVID-19 pandemic. Journal of Research on Technology in Education, 54(sup.1), S1-S13. https://doi.org/10.1080/15391523.2021.1991703
Martín-García, A. V., Martínez-Abad, F., & Reyes-González, D. (2019). TAM and stages of adoption of blended learning in higher education by application of data mining techniques. British Journal of Educational Technology, 50(5), 2484-2500. https://doi.org/10.1111/bjet.12831
Mohamed, A. S. (2021). Experience sharing on virtual COOP training to mechanical engineering students during the COVID-19 pandemic. Sustainability, 13(20), Article 11401. https://doi.org/10.3390/su132011401
Montagud Mascarell, M. D., & Gandía Cabedo, J. L. (2014). Entorno virtual de aprendizaje y resultados académicos: evidencia empírica para la enseñanza de la Contabilidad de Gestión [Virtual learning environment and academic outcomes: Empirical evidence for the teaching of management accounting]. Revista de Contabilidad, 17(2), 108-115. https://doi.org/10.1016/j.rcsar.2013.08.003
Ngai, E., Poon, J., & Chan, Y. (2007). Empirical examination of adoption of WebCT using TAM. Computers & Education, 48(2), 250-267. https://doi.org/10.1016/j.compedu.2004.11.007
Preacher, K. J., & Hayes, A. F. (2004). SPSS and SAS procedures for estimating indirect effects in simple mediation models. Behavior Research Methods, Instruments & Computers, 36(4), 717-731. https://doi.org/10.3758/BF03206553
Quevedo-Arnaiz, N. V. Q., García-Arias, N. G., & Cañizares-Galarza, F. P. C. (2021). Development of research competences during the COVID-19 pandemic. Revista Conrado, 17, 312-320. https://conrado.ucf.edu.cu/index.php/conrado/article/view/1784
Ranellucci, J., Rosenberg, J. M., & Poitras, E. G. (2020). Exploring pre-service teachers’ use of technology: The technology acceptance model and expectancy-value theory. Journal of Computer Assisted Learning, 36(6), 810-824. https://doi.org/10.1111/jcal.12459
Rodríguez-Sabiote, C., Úbeda-Sánchez, Á.M., Álvarez-Rodríguez, J., & Álvarez-Ferrándiz, D. (2020). Active learning in an environment of innovative training and sustainability. Mapping of the conceptual structure of research fronts through a bibliometric analysis. Sustainability, 12, 1-18. https://doi.org/10.3390/su12198012
Rodríguez-Sabiote, C., Valerio-Peña, A. T., & Batista-Almonte, R. (2023). Validation of a scale of the Extended Technology Acceptance Model in the dominican context. Pixel-Bit. Revista de Medios y Educación, 68, 217-244. https://doi.org/10.12795/pixelbit.100352
Roitsch, J., Moore, R. L., & Horn, A. L. (2021). Lessons learned: What the COVID-19 global pandemic has taught us about teaching, technology, and students with autism spectrum disorder. Journal of Enabling Technologies, 15(2), 108-116. https://doi.org/10.1108/JET-12-2020-0053
Sánchez-Prieto, J.C., Olmos-Migueláñez, S., & García-Peñalvo, F. J. (2017). MLearning and pre-service teachers: An assessment of the behavioral intention using an expanded TAM model. Computers in Human Behavior, v.72, 644-654. https://doi.org/10.1016/j.chb.2016.09.061
Schepers, J., & Wetzels, M. (2007). A meta-analysis of the technology acceptance model: Investigating subjective norm and moderations effects. Information & Management, 44(1), 90-103. https://doi.org/10.1016/j.im.2006.10.007
Severt, K., Shin,Y.H.,Chen, H.S., & DiPietro, R.B. (2020). Measuring the relationships between corporate social responsibility, perceived quality, price fairness, satisfaction, and conative loyalty in the context of local food restaurants, international. Journal of Hospitality & Tourism Administration, 23(3), 623-645, https://doi.org/10.1080/15256480.2020.1842836
Şimşek, A. S., & Ateş, H. (2022). The extended technology acceptance model for Web 2.0 technologies in teaching. Innoeduca: International Journal of Technology and Educational Innovation, 8(2), 165-183. https://doi.org/10.24310/innoeduca.2022.v8i2.15413
Schmidhuber, J., Pound, J., Qiao, B. (2020). COVID-19: Channels of transmission to food and agriculture. Roma. Food and Agriculture Organization. https://doi.org/10.4060/ca8430en
Talantis, S., Shin, Y. H., & Severt, K. (2020). Conference mobile application: Participant acceptance and the correlation with overall event satisfaction utilizing the technology acceptance model (TAM). Journal of Convention & Event Tourism, 21(2), 100-122. https://doi.org/10.1080/15470148.2020.1719949
Tan, K. H., Chan, P. P., & Said, N. E. M. (2021). Higher education students’ online instruction perceptions: A quality virtual learning environment. Sustainability, 13(9), Article 10840. https://doi.org/10.3390/su131910840
Tırpan, E. C., & Bakirtas, H. (2020). Technology acceptance model 3 in understanding employee’s cloud computing technology. Global Business Review, 25(1), 117-136. https://doi.org/10.1177/0972150920957173
Unger, S., & Meiran, W. R. (2020). Student attitudes towards online education during the COVID-19 viral outbreak of 2020: Distance learning in a time of social distance. International Journal of Technology in Education and Science, 4(4), 256-266. http://doi.org/10.46328/ijtes.v4i4.107
Urquidi Martín, A. C., Calabor Prieto, M. S., & Tamarit Aznar, C. (2019). Entornos virtuales de aprendizaje: modelo ampliado de aceptación de la tecnología [Virtual learning environments: Extending the technology acceptance model]. Revista Electrónica de Investigación Educativa, 21, Article e22. https://doi.org/10.24320/redie.2019.21.e22.1866
Uzunboylu, H., Bicen, H., & Cavus, N. (2011). The efficient virtual learning environment: A case study of Web 2.0 tools and Windows Live Spaces. Computers & Education, 56(3), 720-726. https://doi.org/10.1016/j.compedu.2010.10.014
Venkatesh, V. (2000). Determinants of perceived ease of use: Integrating control, intrinsic motivation, and emotion into the technology acceptance model. Information Systems Research, 11(4), 342-365. https://doi.org/10.1287/isre.11.4.342.11872
Weller, M. (2007). Virtual learning environments: Using, choosing and developing your VLE. Routledge. https://doi.org/10.4324/9780203964347
Williamson, B., Eynon, R., & Potter, J. (2020). Pandemic politics, pedagogies and practices: Digital technologies and distance education during the coronavirus emergency. Learning, Media and Technology, 45(2), 107-114. https://doi.org/10.1080/17439884.2020.1761641
Wismantoro, Y., Himawan, H., & Widiyatmoko, K. (2020). Measuring the interest of smartphone usage by using technology acceptance model approach. The Journal of Asian Finance Economics and Business, 7(9), 613-620. https://doi.org/10.13106/jafeb.2020.vol7.no9.613
Yong-Varela, L. A., Rivas Tovar, L. A., & Chaparro, J. (2010). Modelo de aceptación tecnológica (TAM): un estudio de la influencia de la cultura nacional y del perfil del usuario en el uso de las TICS [Technological acceptance model (TAM): A study of the influence of the national culture and of the user profile in the use of ICTS]. Innovar: Revista de Ciencias Administrativas y Sociales, 20(36), 187-203.
Zumbo, B. D., Gadermann, A. M., & Zeisser, C. (2007). Ordinal versions of coefficients alpha and theta for Likert rating scales. Journal of Modern Applied Statistical Methods, 6(1), 21-29. https://doi.org/10.22237/jmasm/1177992180

Perceived Utility and Learning by Dominican University Students in Virtual Teaching-Learning Environments: An Analysis of Multiple Serial Mediation Based on the Extended Technology Acceptance Model by Clemente Rodríguez-Sabiote, Ana T. Valerio-Peña, Roberto A. Batista-Almonte, and Álvaro M. Úbeda-Sánchez is licensed under a Creative Commons Attribution 4.0 International License.